Plotting based on AVS data
Go to the AVS graphics tab (Picture 1):
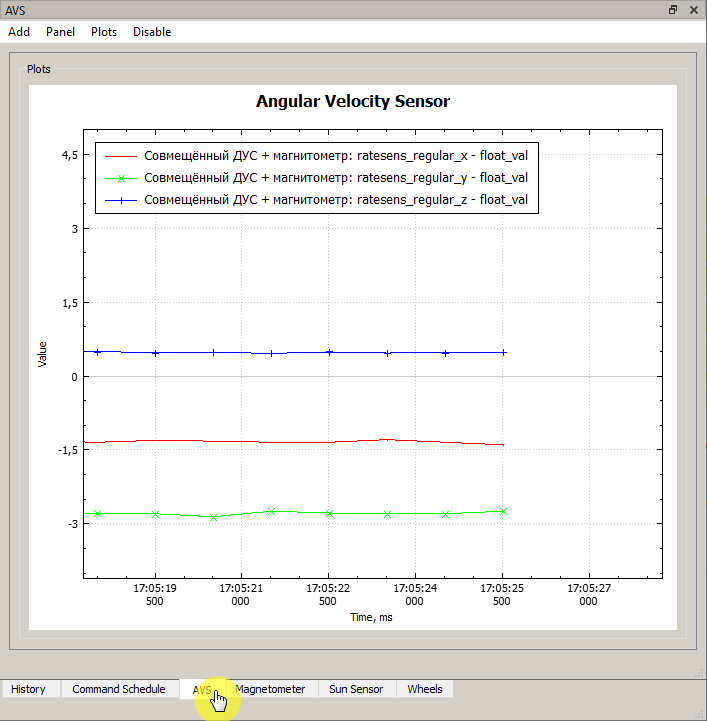
Picture 1. AVS graph
By default, the period for sending telemetry packets from AVS and magnetometer is 1 s. The time of receipt of information is indicated on the horizontal axis.
Changing the scale
To change the scale along the horizontal axis, select the axis (it will turn blue), and then change the scale using the mouse wheel (Picture 2):
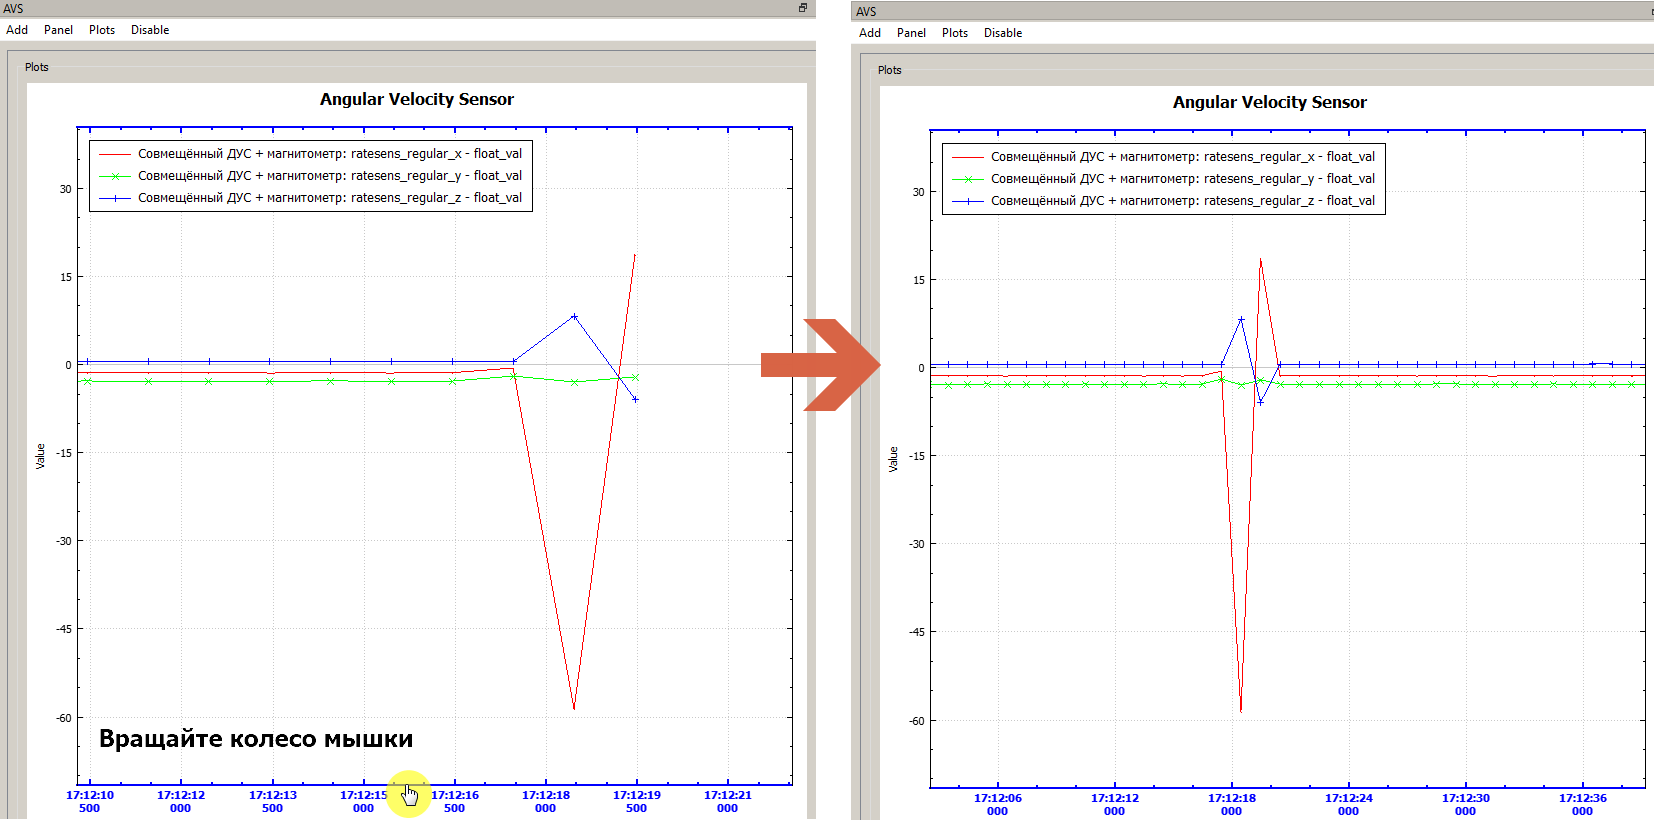
Picture 2. Changing the scale
You can move left and right along the time axis by pressing the left mouse button (hereinafter LMB) on the time axis and moving the mouse (Picture 3):
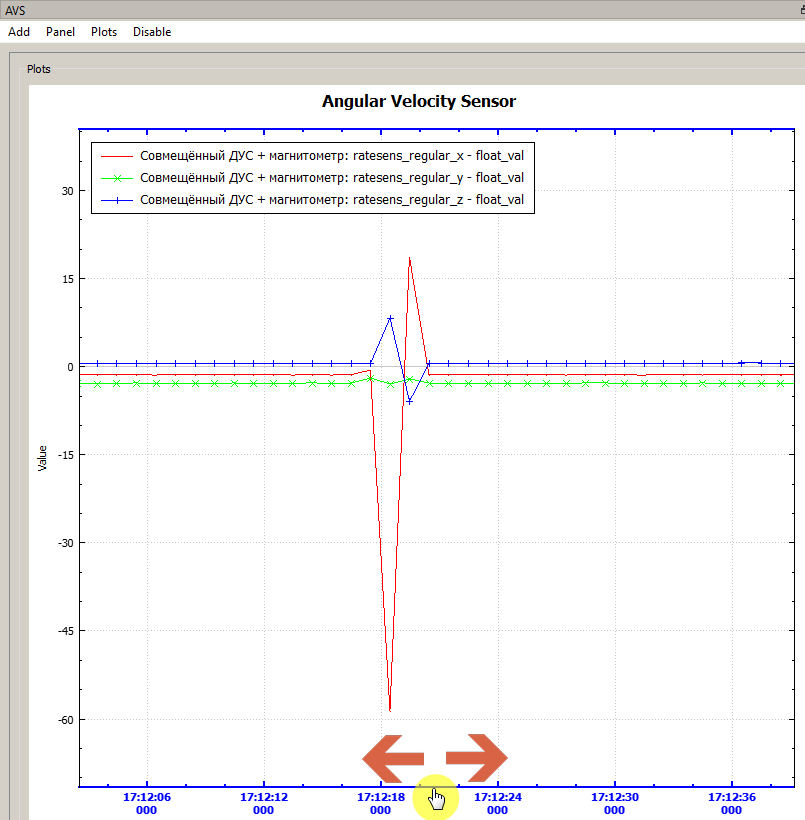
Picture 3. Moving along the axis
The scale of the graph changes automatically, but if necessary it can be changed by selecting the vertical axis (Picture 4):
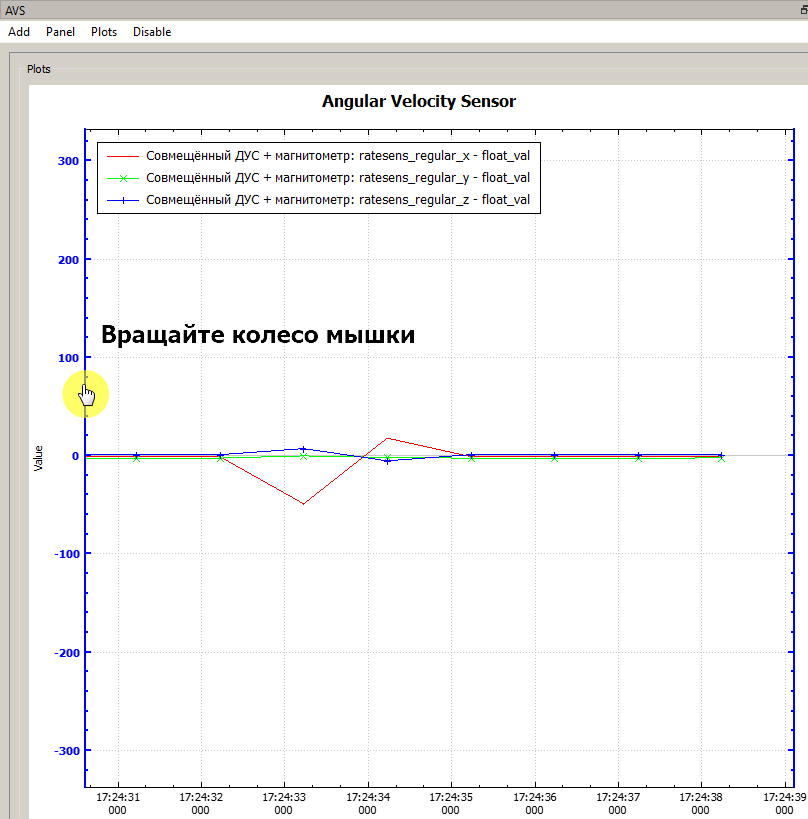
Picture 4. Changing the scale
Changing axis signatures
Axis labels can be changed by double-clicking (Picture 5):

Picture 5. Changing the axis signature
Automatic scaling
Automatic scaling of graphs can be enabled and disabled in the menu (Picture 6):

Picture 6. Automatic scaling of graphs
To get the exact value at the selected point of the graph, select the graph and double-click to create a "marker" at the point of interest. The status bar will display the values of this graph point (Picture 7):
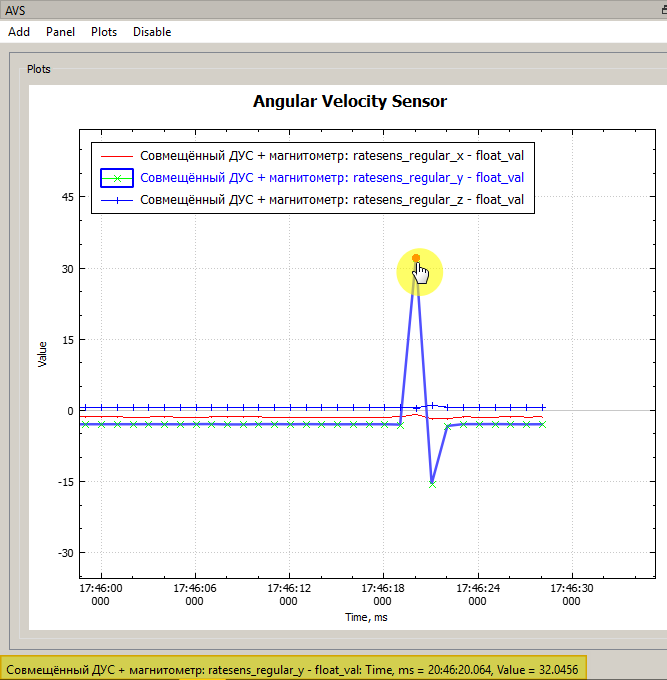
Picture 7. Getting the exact value at the point of the graph
Right button menu
By right-clicking on the graph area, you can perform a number of actions (Picture 8):
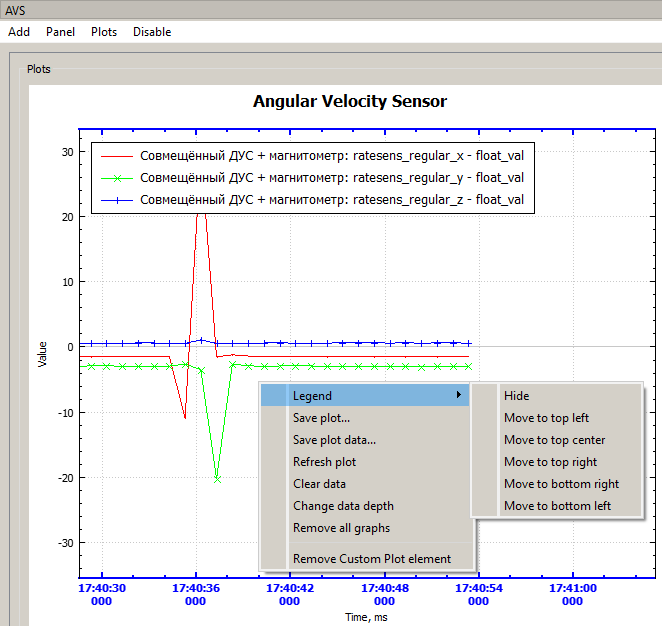
Picture 8. Possible actions with the schedule
- Legend – show/hide/move the description of the graph designations;
- Save plot – save the current image to a graphic file (png, jpeg, pdf, bmp);
- Save plot data – save the data of the selected graph to a .csv file (downloading a large amount of data may take a long time);
- plot – redrawing the graph;
- Clear data – clear graph data;
- Change data depth – the number of points displayed on the chart;
- Remove all graphs – delete constructed graphs;
- Remove Custom plot element – delete the plotting field.
Downloading a large amount of data can take a long time!