Laser rangefinder
Laser satellite rangefinder has been used for half a century to determine the distance between a spacecraft and a ground station, as well as to compile digital three-dimensional maps of the relief of the Earth and other planets.
The principle of operation of the laser rangefinder
A laser rangefinder is a laser that gives a very short pulse, measured in nano and picoseconds. And although the pulse energy is small 0.1-0.05 joules, the radiation power is colossal on the order of 250 megawatts or more. The principle of operation is as follows: ultrashort pulses are sent from a ground station in the direction of a spacecraft equipped with special optical reflectors, then a reflected signal is received at the same station. This is a method of determining the range of action by pointing at an object or surface of a laser and measuring the time it takes for the reflected light to return to the receiver.
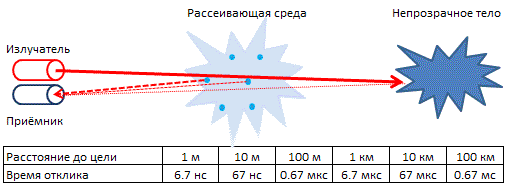
Picture 1. The principle of operation of the laser rangefinder
Laser rangefinder in the OrbiCraft 3D educational designer
For the LD to work correctly and receive data, it is necessary to independently produce a relief and install it on the globe. For example, you can print a 3D model of your terrain or cut it out of styrofoam. During the passage of the satellite, the laser scans the surface of the planet and outputs all data to the Web interface. When the distance to the planet changes, the data will also change, this can be seen using the graph in the Houston Application, which is an inversion of the elevation above the surface of the globe.
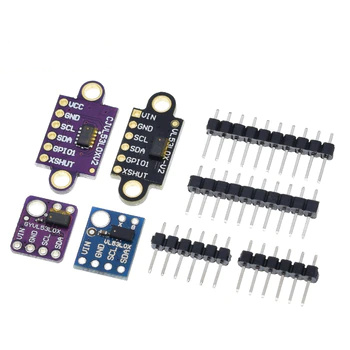
Picture 2. Laser rangefinder
As part of the study of the designer, we will try to transfer data from a rangefinder that is connected to a microcontroller. To connect the rangefinder, use the connection diagram below:

Picture 3. Connection diagram of the laser rangefinder
You will need the library Adafruit_VL53L1X.h
We receive data from the laser rangefinder and send it to Raspberry via the Arduino board. Raspberry receives a message with data from the Arduino and then displays it on the screen in the WEB interface. In addition, you can also output the received data to the Huston Application to obtain a graph of changes in the terrain of the Terra Earth simulator. For the laser rangefinder to work correctly, the program must also stabilize the orientation so that the rangefinder can scan a specific terrain.
Working with the Houston Application
Let's fix the essence of the laser rangefinder. The receiver, having received data from the rangefinder, processes them and transmits them via the CAN bus to the satellite's BVM. Then, via WI-Fi, the satellite receiver sends data to the Houston Application.
In order to display the values that are sent to the receiver satellite, it is necessary:
1) Correctly configure the IP address of the satellite you are working with. To do this, go to the File tab, then Parameters, then Connections. In the serverAddress line, make sure that you have the correct IP address of the satellite from which you are receiving data.
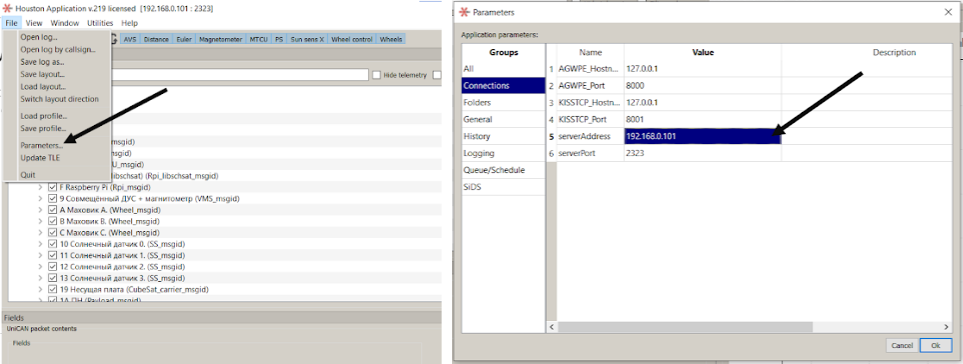
Picture 4. Setting up the satellite's IP address
2) If everything is connected correctly, leave a check mark in the Packets window only for 1A MON. After that, in the History column, you will have the data that the rangefinder transmits. Click on any value on the right and in the Fields window, then Value you will see the distance that the rangefinder sent in millimeters.
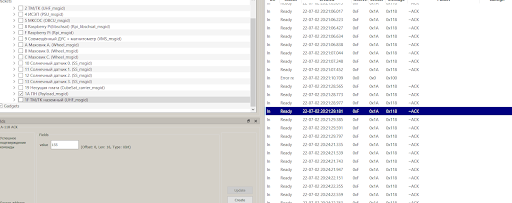
Picture 5. The data that the rangefinder transmits
3) To visualize the data, go to the Window, then New Instrument Panel and give the name of the new panel, for example, Lazer_Distance.
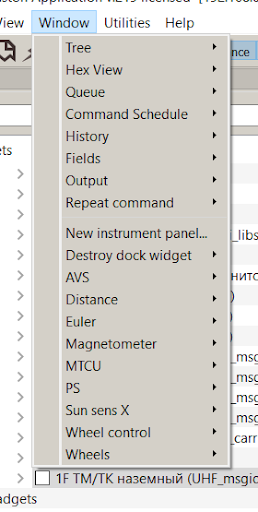
Picture 6. Adding a new panel

Picture 7. New Panel Settings
4) Next, Add, Custom Plot and without changing anything, click OK (You can set the name of the graph- Title).
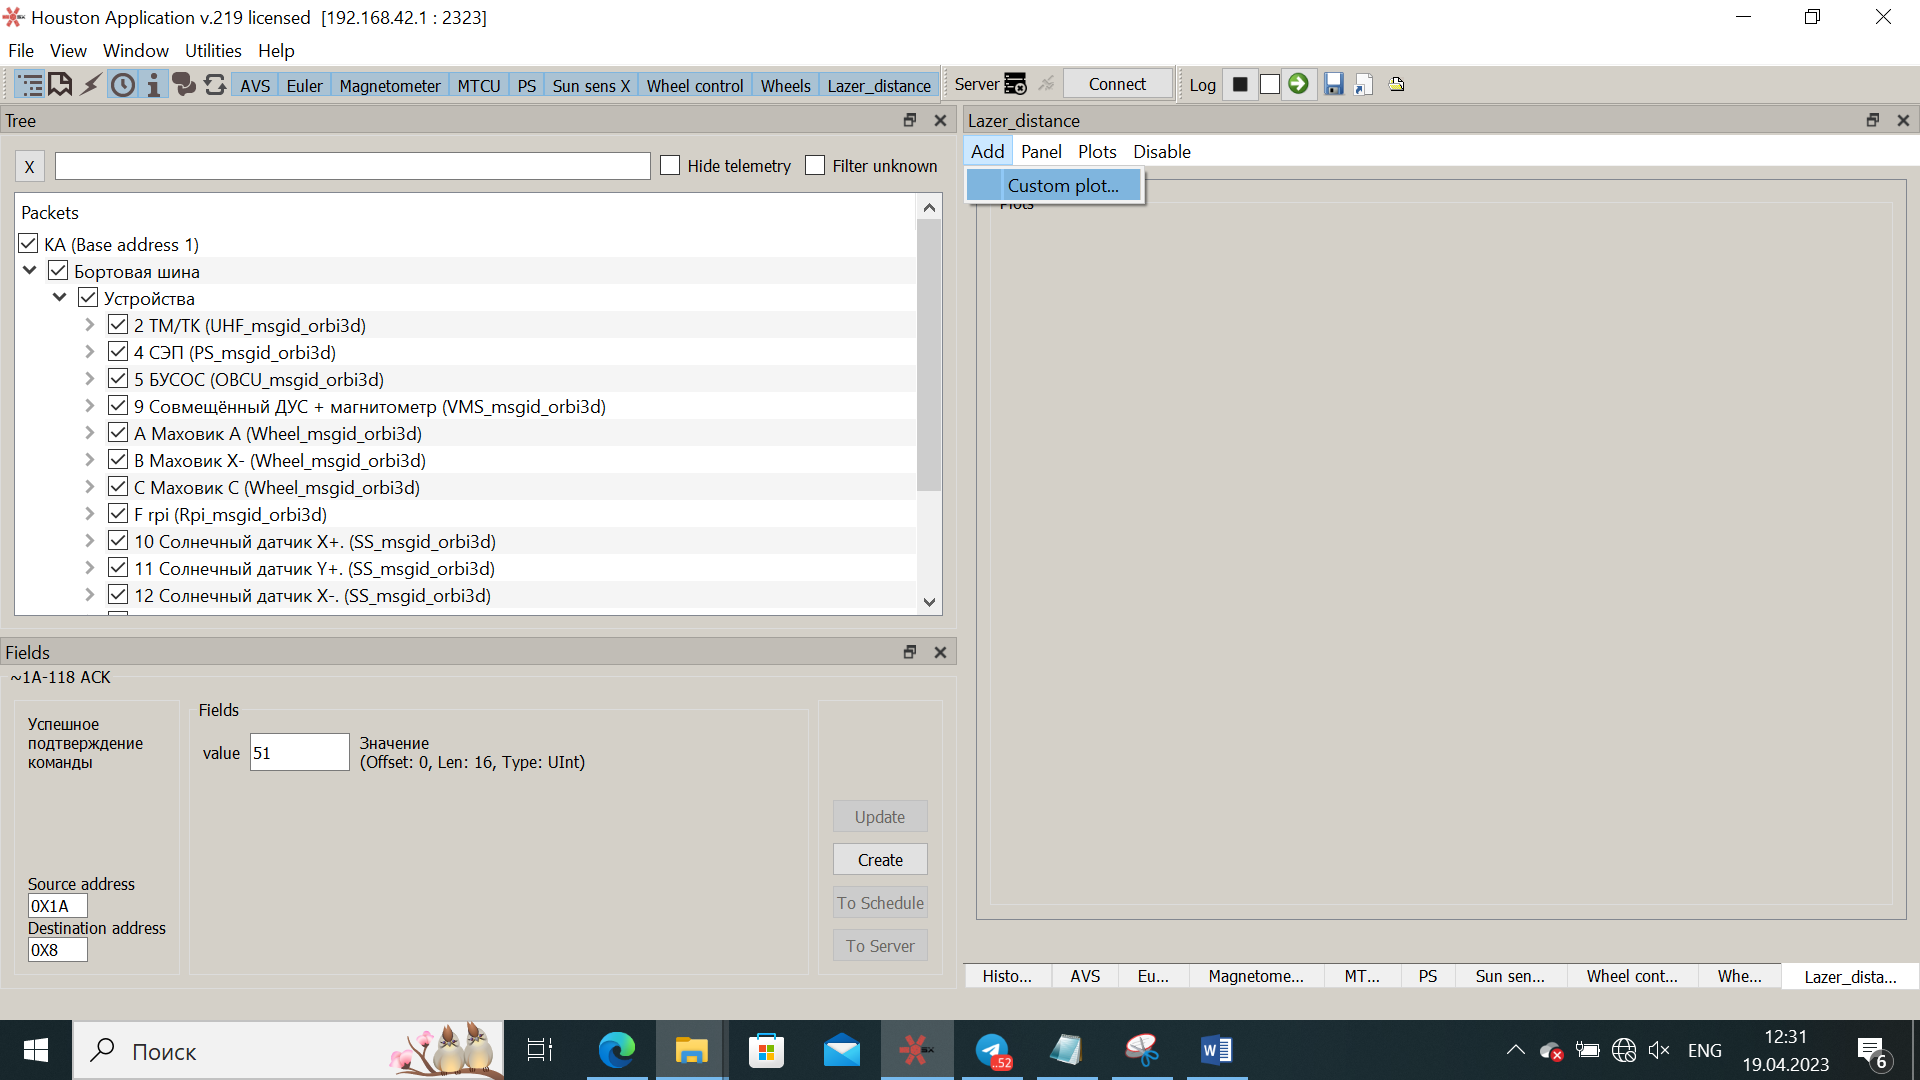
Picture 8. Adding a new graph

Picture 9. New chart Settings
5) Now we need to display the values received from the Arduino on the created graph. To do this, find the message from Arduino in the History tab and left-click on it. You will see one of the received values in the Fields window. Right-click on it, and in the window that opens, select Add to plot - (The name of your panel).
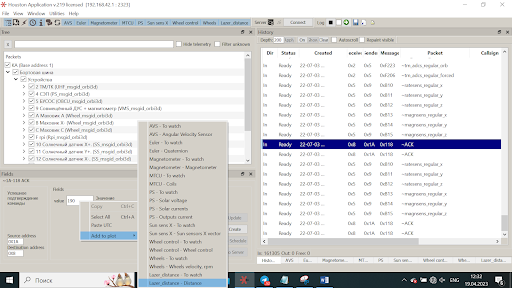
Picture 10. Displaying the created graph
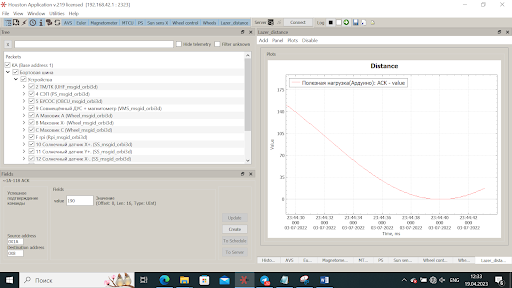
Picture 11. An example of the resulting graph
Now, in your added panel, you can observe the graph of changes in the terrain of the Terra Earth simulator.