Spectrum Analyzer
To date, one of the most important missions of satellites is remote sensing of the Earth (remote sensing). In Russia, this task is performed by many spacecraft: some of them are engaged in monitoring territories (devices of the Resurs-P, Canopus-V and Canopus-V-Ik series), while others control the hydrometeorological situation (Meteor-M and Electro-L). They allow us to monitor agricultural land, monitor forest cover, prevent forest fires and much more. Our company also has its own device that performs the mission of the remote sensing OrbiCraft-Vigilant.
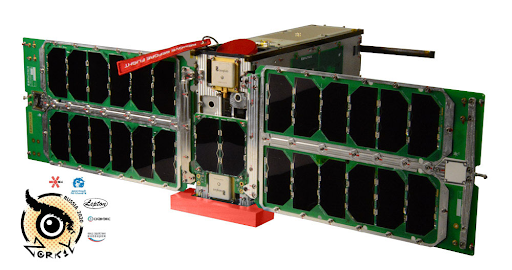
Picture 1. OrbiCraft-Vigilant
The spectrum analyzer also allows us to carry out a remote sensing mission: for example, to determine the type of surface.
Spectrum analyzer module in the OrbiCraft 3D educational designer
Our designer uses a TCS34725FN-based color sensor for Arduino as a payload:
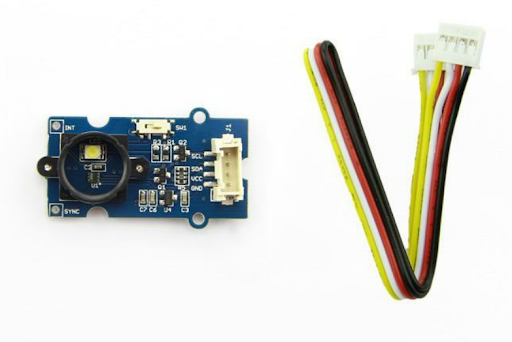
Picture 2. Color sensor based on TCS34725FN
The sensor consists of 16 filter photodiodes (4 have red filters, 4 have green filters, 4 have blue filters, 4 do not have filters (transparent)) and 16-bit analog-to-digital converters. Using the sensor, you can detect the color of the ambient light or the color of objects.
The principle of operation of the spectrum analyzer
The sensor recognizes 4 colors: red, green, blue and white. To begin with, the average typical values of each surface are set to the sensor (these values are measured for each of the 4 zones). After that, the surface of the globe is scanned and the relief values determined by the sensor are output to the Web interface via transmission from Arduino to Raspberry via the CAN bus. For the spectrum analyzer to work correctly, the program must also perform orientation stabilization. Based on the sensor readings obtained from these four values, it is possible to construct a stripe image corresponding to the scanned surface by writing a program in the Python programming environment using the matplotlib library.