05 Lesson. Getting raw data from a magnetometer.
Getting to know the magnetometer of a smartphone
Almost every modern smartphone has a magnetometer installed, let's get to know it. Install an application in your smartphone to visualize the data received from the built-in magnetometer, for example, MagnetMeter (Picture 1):

Picture 1. MagnetMeter Application
Open the application and you will see a blue arrow that shows the direction of the magnetic field lines (Picture 2):

Picture 2. Magnetic field lines
Rotate your smartphone and make sure that the magnetic lines are always directed in one direction – almost to the north. In addition to the Earth's field, other magnetic fields affect the readings of the magnetometer. Make sure of this by bringing the magnet closer to your smartphone. By moving the magnet near the smartphone, determine the exact location of the magnetometer in the smartphone case (Picture 3):

Picture 3. The direction of the magnetic lines when rotating the smartphone
Pay attention to the magnitude of the intensity of the Earth's magnetic field and the field near the magnet.
Checking the performance of the Orbicraft magnetometer
In the Orbicraft 3D designer, the magnetometer is installed on the BVM board. Connect the BVM to the BOT. Download the program and run it.
Code in C:
#include <stdio.h>
#include <stdint.h>
#include "libschsat.h"

void control(void){
/*Setting the period for sending telemetry by the magnetometer*/
magnetometer_gyro_set_telemetry_period(0, 500);
/*Declaring variables*/
float mag_x = 0, mag_y = 0, mag_z = 0;
uint16_t mag_num = 0;

/*Output 20 magnetometer values at 2 values per second*/
for (int i = 0; i < 20; i++){
mSleep(500); /*Delay interval*/
/*We get the values of the magnetometer*/
magnetometer_request_raw(mag_num, &mag_x, &mag_y, &mag_z);
/*Output magnetometer values*/
printf("%f%f%f\t\n", mag_x, mag_y, mag_z);
}
puts("Sent");
}
Run the program and look at the values it outputs. If the BVM is not rotated, the values do not change. If you rotate it, the values will change. If you rotate the magnetometer around one of the axes, one of the three numerical values will mainly change, the other two will change to a lesser extent. Hold a magnet up to the magnetometer and see how the values change when the magnet moves at a stationary magnetometer.
Getting the azimuth from the magnetometer
Print out the protractor (Picture 4), glue it to the table with adhesive pads that do not leave traces (analogous to UHU patafix), then install Orbicraft 3D on the protractor, and rotate it by 30 degrees with an interval of 10 seconds (Picture 5):
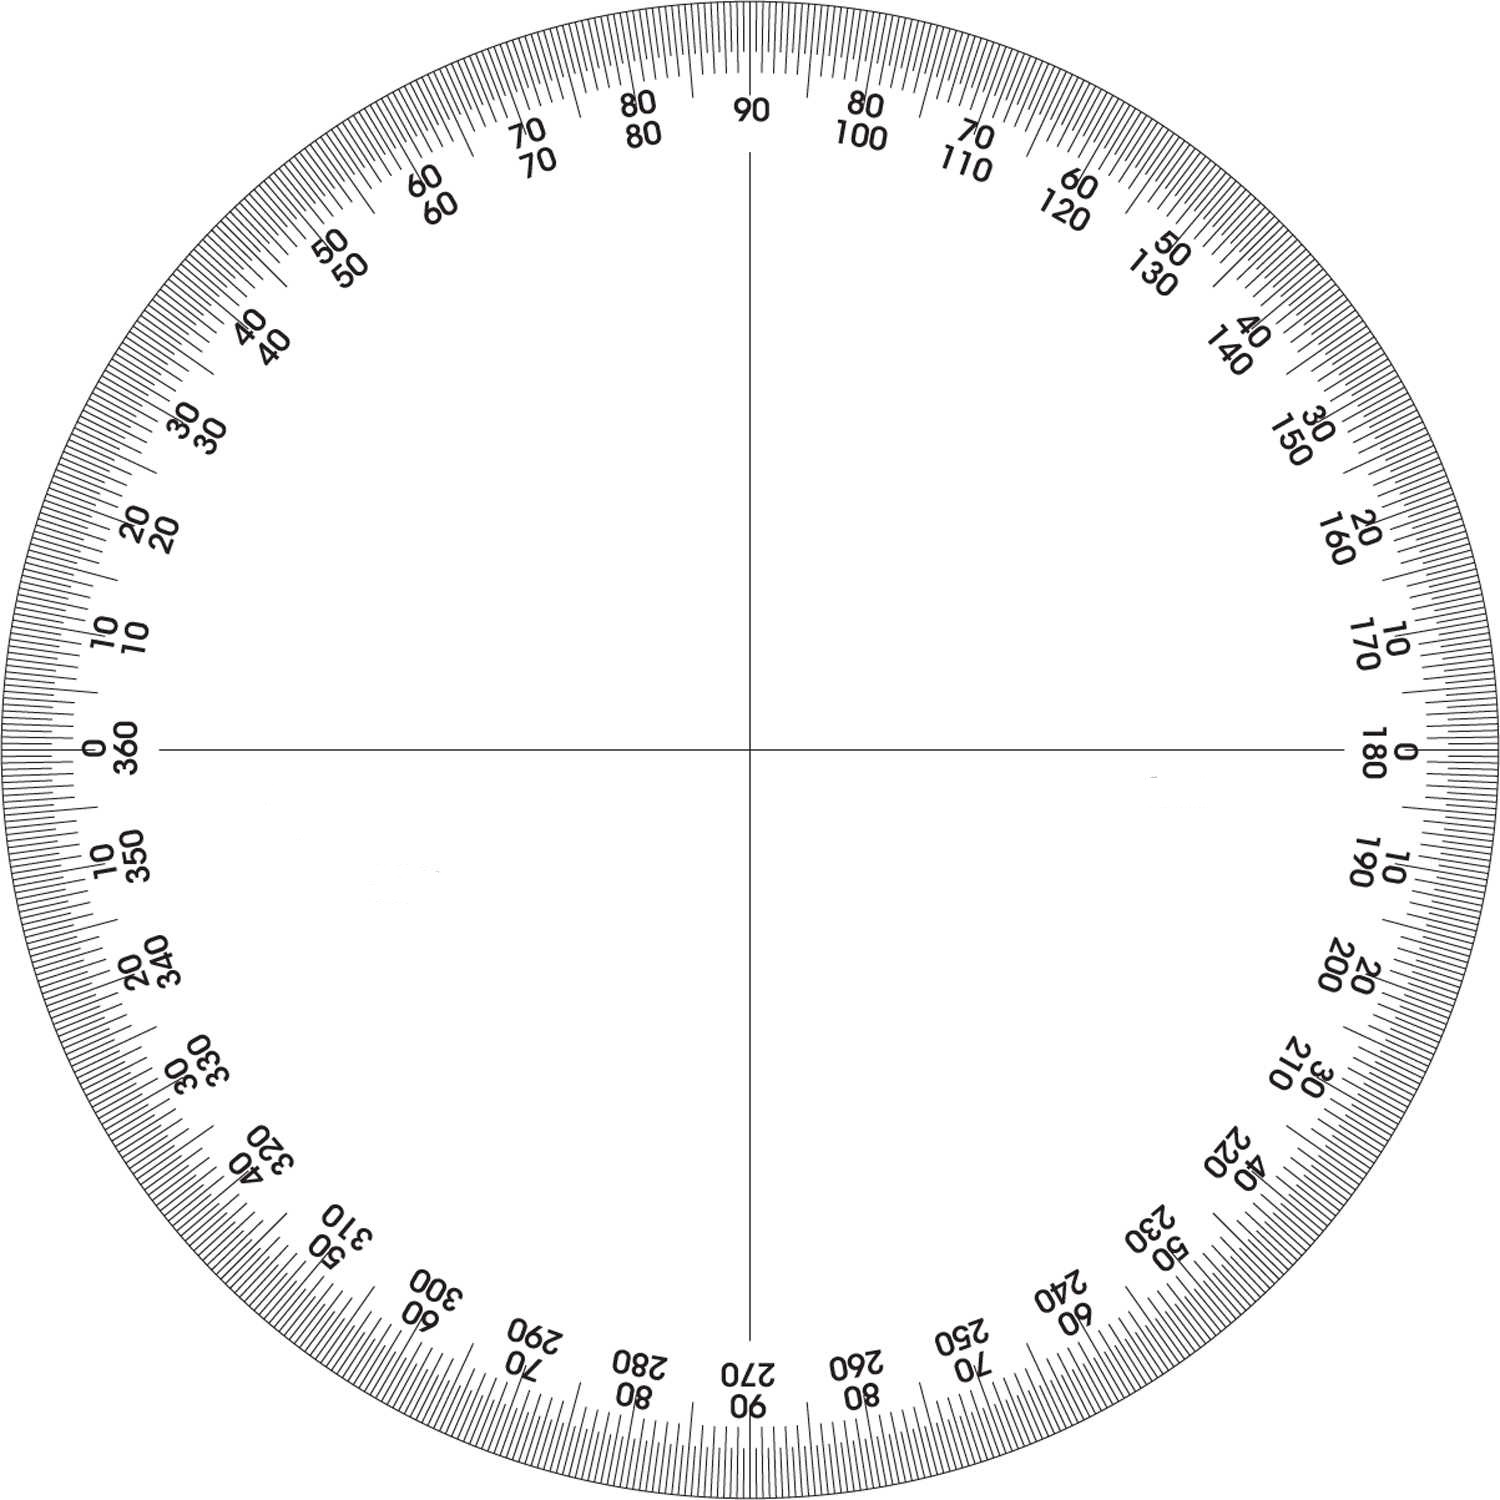
Picture 4. Protractor
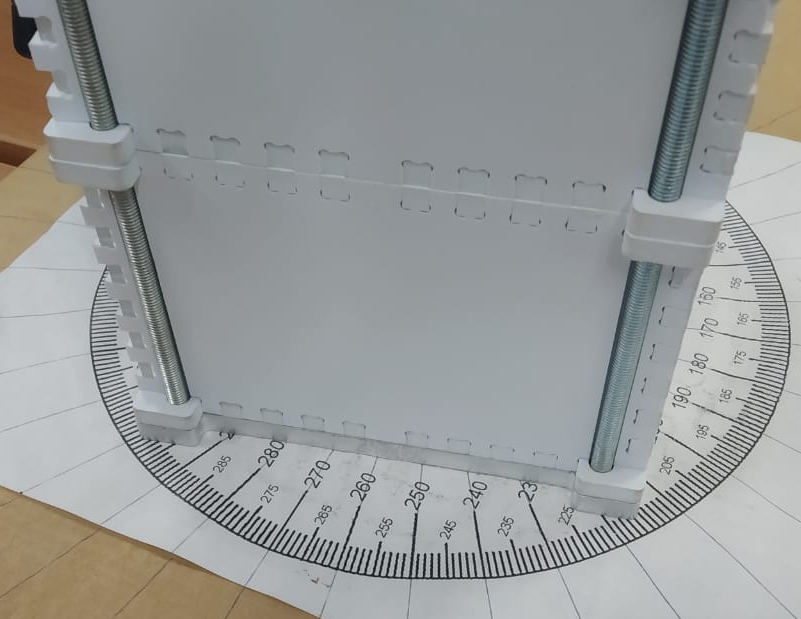
Picture 5. Installing OrbiCraft 3D on a printed protractor
Type the following program into the Web Interface, which will make 60 measurements in increments of 1 second.
Code in C:
#include <stdio.h>
#include <stdint.h>
#include <math.h>
#define M_PI 3.146284827473
#include "libschsat.h"

void control(void){
/*Setting the period for sending telemetry by the magnetometer*/
magnetometer_gyro_set_telemetry_period(0, 100);
/*Declaring variables*/
float mag_x = 0, mag_y = 0, mag_z = 0;
uint16_t mag_num = 0;
float mag_alpha;

/*Output 13 magnetometer values once every 10 seconds*/
for (int i = 0; i < 13; i++){
mSleep(10000); /*10 sec delay interval*/
/*We get the values of the magnetometer*/
magnetometer_request_raw(mag_num, &mag_x, &mag_y, &mag_z);
/*Calculating the azimuth*/
mag_alpha = atan2(mag_y, mag_x)*180/M_PI;
/*We output the azimuth values*/
printf("alfa = %d mag_alpha = %f\n", i*30, mag_alpha);
}
puts("Sent");
}
Rotate the magnetometer in 30 degree increments and record the output angle value in an EXCEL spreadsheet with degree accuracy. You should get a similar data table (Picture 6):

Picture 6. The values obtained at angles in increments of 30 degrees
Data analysis in Excel
Please note that when rotating by 30 degrees, the angle value output by the magnetometer does not change exactly by 30 degrees. Let's calculate these values using EXCEL tools.
Creating a table
Create a new column that will contain the difference of adjacent numbers. Enter an equal sign in an empty cell C2, and then click on cell B2, enter the "-" sign, and then click on cell B1 and press Enter (Picture 7):

Picture 7. Creating a column with a number difference
The difference B1-B2 will be calculated in cell C2. Pull down the corner — the formula will be automatically copied to all the lower cells (Picture 8):

Picture 8. The result of the subtraction
The differences will be calculated automatically (Picture 9):

Picture 9. Finished column
Please note that the value -341 is clearly erroneous. When passing through the value of 180 degrees, the sign of the measured angle changed, therefore the formula =B6-B5 should be changed as follows =(180+B6)+(180-B5) which is equivalent to =360+B6-B5 (Picture 10):

Picture 10. Changing the formula
Charting
Now you need to build a graph to visually see the distortions introduced into the angle measurement by an uncalibrated magnetometer. Highlight the calculated values of the differences (Picture 11):

Picture 11. Selecting a column to build a chart
Click Insert and select the pie chart (Picture 12):

Picture 12. Inserting a pie chart
Picture 13. Pie chart
Right-click on the colored circle and select the white fill color and the black outline color (Picture 132):

Picture 14. Choosing the chart fill color

Picture 15. Choosing the color of the outline of the diagram
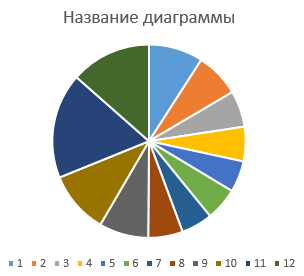
Now it can be seen with the naked eye that the magnetometer is far from ideal — the sectors of the circle are not exactly 30 degrees. Some are narrower and some are wider (Picture 14):
Picture 16. The constructed pie chart
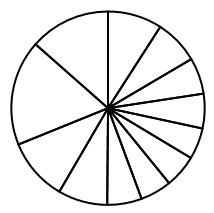
Let's build another graph that clearly illustrates the imperfection of the magnetometer. Highlight the calculated values of the differences. Click Insert and select the petal diagram (Picture 15):

Picture 17. Inserting a petal diagram
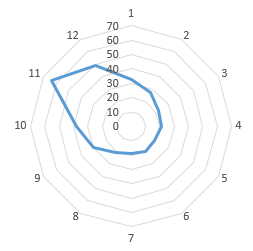
Picture 18. Building a petal diagram
Now it is very clearly seen that the values are far from the ideal 12 of a square with a radius of 30.
Data analysis using functions
And now let's calculate the average value of the difference between the measured angles using the EXCEL CP VALUE function. Select any cell, enter the equal sign, the name of the function and open the bracket (Picture 16):
![]()
Picture 19. Entering a formula for calculating averages
Then select with the mouse the range of calculated values of the differences on the basis of which we built the diagrams and close the bracket. The function will look like this =CP VALUE(C1:C12). Press Enter and the function will calculate the average value of the specified numbers. Now let's calculate the standard deviation of the calculated differences from the average value, which will show the magnitude of the spread of values relative to the average. To do this, we use the STANDARD SLOPE function. Select any cell, enter the equal sign, the name of the function and open the bracket (Picture 17):
![]()
Picture 20. Entering a formula for calculating the magnitude of the spread of values relative to the average
Then select with the mouse the range of calculated values of the differences on the basis of which we built the diagrams and close the bracket. The function will look like this =STANDARD SLOPE(C1:C12). Press Enter and the function will calculate the standard deviation of the calculated differences from the average value. Now calculate the percentage of the mean value and the standard deviation. To do this, divide the resulting value of the standard deviation by the average value of the specified numbers (Picture 18):


Picture 21. Calculating the percentage of the average value and the standard deviation
As you can see, the spread is very large and is 47% of the average value. The magnetometer must be calibrated.
Getting raw data for magnetometer calibration
By default, the magnetometer is not calibrated, i.e. it gives inaccurate values. Refined values can be obtained from raw data by calibration, which consists in finding the transformation matrix and the displacement vector. The raw data from the magnetometer can be obtained by executing the C code shown below. During data collection, the BKU with a built-in magnetometer must be randomly rotated, trying to turn it in all possible directions.
Code in C:
#include <stdio.h>
#include <stdint.h>
#include "libschsat.h"

void control(void){
    /*Setting the period for sending telemetry by the magnetometer*/
magnetometer_gyro_set_telemetry_period(0, 100);
    /*Declaring variables*/
float mag_x = 0, mag_y = 0, mag_z = 0;
uint16_t mag_num = 0;

    /*Output 500 magnetometer values at 10 values per second*/
for (int i = 0; i < 500; i++){
mSleep(100); /*Delay interval*/
        /*We get the values of the magnetometer*/
        magnetometer_request_raw(mag_num, &mag_x, &mag_y, &mag_z);
        /*Output magnetometer values*/
printf("%f%f%f\t\n", mag_x, mag_y, mag_z);
}
puts("Sent");
}
In the Orbicraft 3D designer, the magnetometer is installed on the BVM board. Connect the BVM to the BOT. Download the program to the BVM and run it. Randomly rotate the magnetometer to collect raw data from all possible orientations. Save the received data to a file with the extension .txt (for example, in the Notepad program). To do this, select all the results using Ctrl+A, copy using Ctrl+C and save.
Program operation analysis
The program uses the following functions for working with a magnetometer:
a function that returns raw data measured by a magnetometer with the number mag_num, since there is only one magnetometer in the constructor, mag_num is 0 and the function returns three values that are placed in the variables mag_x, mag_y and mag_z:
cpp
magnetometer_request_raw(mag_num, &mag_x, &mag_y, &mag_z)
a loop statement that will be executed 500 times, 500 values will be output accordingly. These values will be needed in the next lesson when calibrating the magnetometer:
for (int i = 0; i < 500; i++)