Solar sensors
The address of the solar sensor modules is 0x10, 0x11, 0x12 and 0x13, which corresponds to 16, 17, 18 and 19 in decimal format (Picture 1):
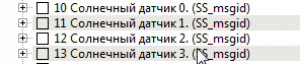
Picture 1. Address of solar sensor modules
All solar sensor modules have the same set of commands and responses (Picture 2):
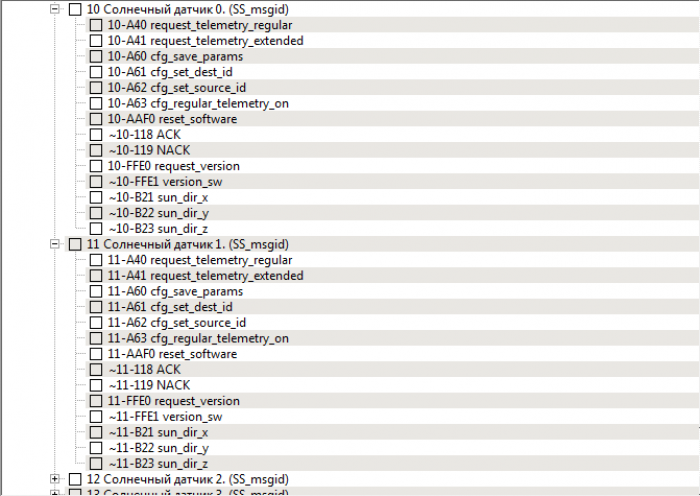
Picture 2. A set of commands for solar sensors
Some commands are similar to the commands of other modules, for example:
- cgf_get_dest_id - setting the address of the packet recipient;
- cgf_regular_telemerty_on - setting the period for sending packets;
- request_version - request the firmware version of the module.
However, the composition of the returned data will be different: data on the angle of direction to the light source will be returned ~10-B21 sun_dir_x, ~10-B21 sun_dir_y, ~10-B21 sun_dir_z.
Set the period 10-A63 cgf_regular_telemerty_on, address 10-A61 cgf_set_dest_id, check the boxes ~10-B21 sun_dir_x, ~10-B21 sun_dir_z (Picture 3):
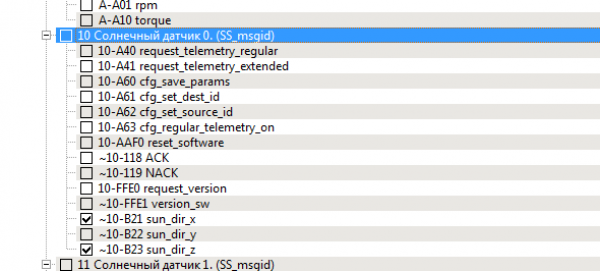
Picture 3. Selection of returned data packets
The History field will display the received packages (Picture 4):
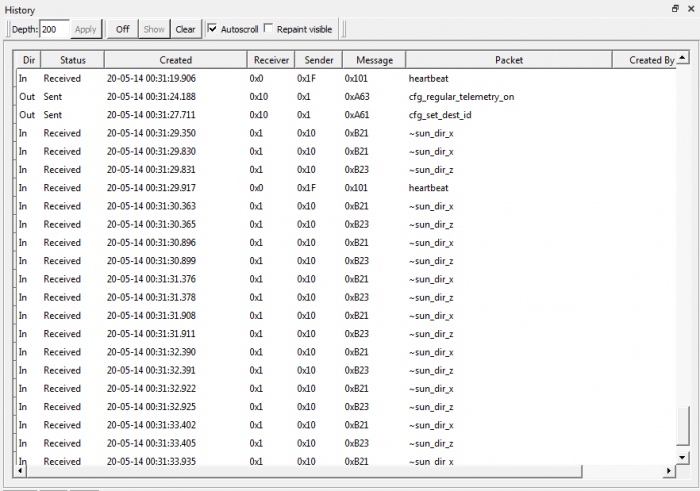
Picture 4. Viewing received packets
Go to the Sun Sensor tab in the graph field (Picture 5):
Picture 5. Sun Sensor Tab
You will see the received raw data. The graph shows the moments of increasing the brightness of the light source (Picture 6):
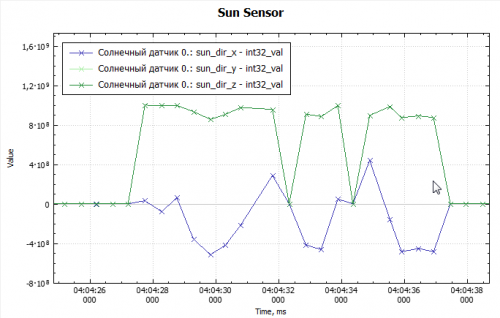
Picture 6. Received raw data
Shine on the solar sensor from one side (about 45° to normal), and then from the other side (about -45° to normal). The resulting graph will look like this (Picture 7):
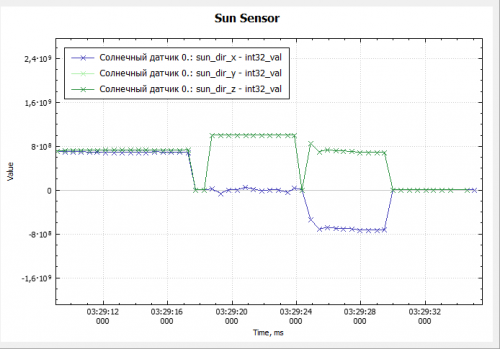
Picture 7. Changing the solar sensor graph
It should be noted that the Houston software is not intended for visualization of final data, and shows graphs in the most "raw" form. In this case, the relative values of the vector projections on x and z are shown (Picture 8):
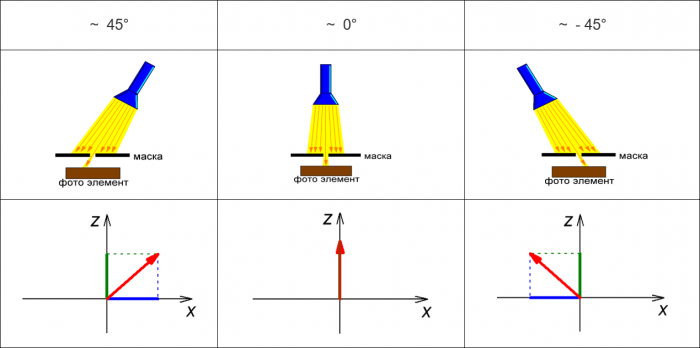
Picture 8. Vector projections on x and z
To calculate the angle values in graphs, logs should be processed, which are saved automatically.