Lesson 4. Analysis of satellite images
Orbits of weather satellites
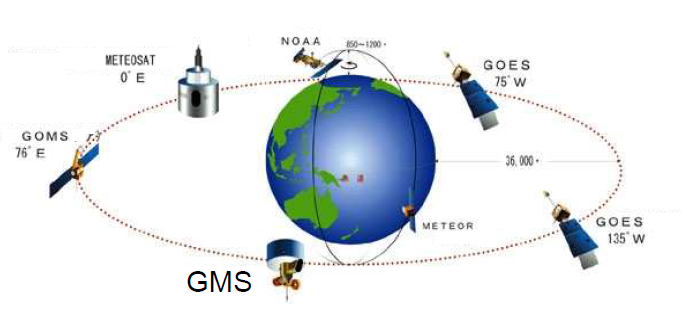
Picture 1. Weather satellites
Weather satellites, as a rule, are launched either into a sun-synchronous orbit or into a geostationary one.
- A geostationary orbit is an orbit in which the period of the satellite's orbit around the Earth is exactly one day. Thus, it turns out that the satellite is "hanging" over the same point on the equator. The distance from the Earth's surface to the geostationary orbit is about 35,800 km. From this height, the satellite can survey about 1/3 of the entire surface of the Earth. Weather satellites are located in this orbit: GOMS (Russia), GOES-15 (USA), Meteosat 10 (EU).
- A sun-synchronous orbit is an orbit in which a satellite passes over any point on the Earth's surface at approximately the same local solar time. Thus, the angle of illumination of the earth's surface will be approximately the same on all satellite passes. Such constant lighting conditions are very well suited for weather satellites. To achieve such characteristics, the orbit parameters are selected in such a way that the orbit precesses in an easterly direction by 360 degrees per year (approximately 1 degree per day), compensating for the rotation of the Earth around the Sun. Meteor satellites are located in this orbit: Meteor-M 2 (Russia), NOAA 15, 18, 19 (USA). Weather satellites in a sun-synchronous orbit do not capture the entire surface of the Earth at once, they scan the image one line at a time and transmit it at a frequency of about 137 MHz in analog format (APT). Special computer programs collect ready-made images from these lines.
Resolution of snapshots
The resolution of the images obtained from the NOAA series satellites is 4 km per pixel. The image consists of two IR channels, using geometric correction of perspective distortions. Thus, we get some kind of average representation of the actual temperature at a specific point on the surface.
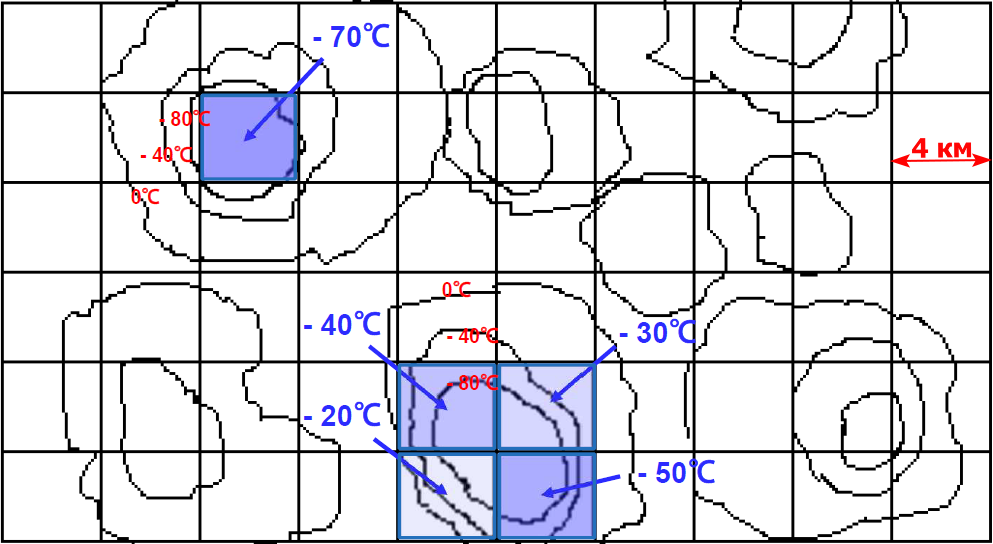
Picture 2. Resolution of images received from NOAA series satellites
Since our planet has the shape of a ball, the pixels located in the center of the image have a size of 4 km × 4 km, and the pixels located at the edges of the image have an elongated shape – 4 km × 8 km or even 4 km × 12 km.
![]()
Picture 3. Pixel location and size
Infrared radiation
Weather satellites photograph the surface in the visible range and in the infrared (IR) range. Infrared radiation is not visible to the human eye, but is recorded by the satellite camera. Infrared radiation is also called "thermal radiation", since infrared radiation from heated objects is perceived by the human skin as a feeling of warmth.
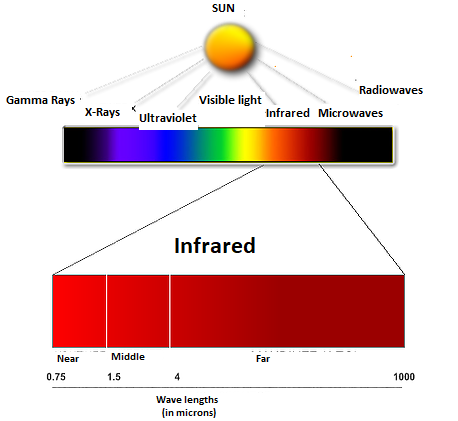
Picture 4. Infrared range
The infrared range is divided into several sub-bands:
- Near IR range
- wavelength λ = 0.74—2.5 microns
- Medium IR range
- wavelength λ = 2.5—50 microns
- Far infrared range
- wavelength λ = 50-2000 microns
Influence of the atmosphere
The Earth's surface and clouds absorb visible and invisible radiation from the Sun and re-emit most of the energy in the form of infrared radiation back into the atmosphere. Some substances in the atmosphere, mainly water droplets and water vapor, absorb this infrared radiation and re-emit it in all directions, including back to Earth. Thus, the greenhouse effect keeps the atmosphere and the surface in a more heated state than if there were no water vapor in the atmosphere. The sunlight illuminating the Earth is partially absorbed by the atmosphere, surface and clouds, and partially reflected from the surface, clouds and aerosols. The satellite camera receives this radiation and forms an image in the visible range. In the infrared range, the satellite's camera also receives radiation from the surface, clouds and atmosphere. Moreover, the radiation of the surface is partially absorbed by the atmosphere.
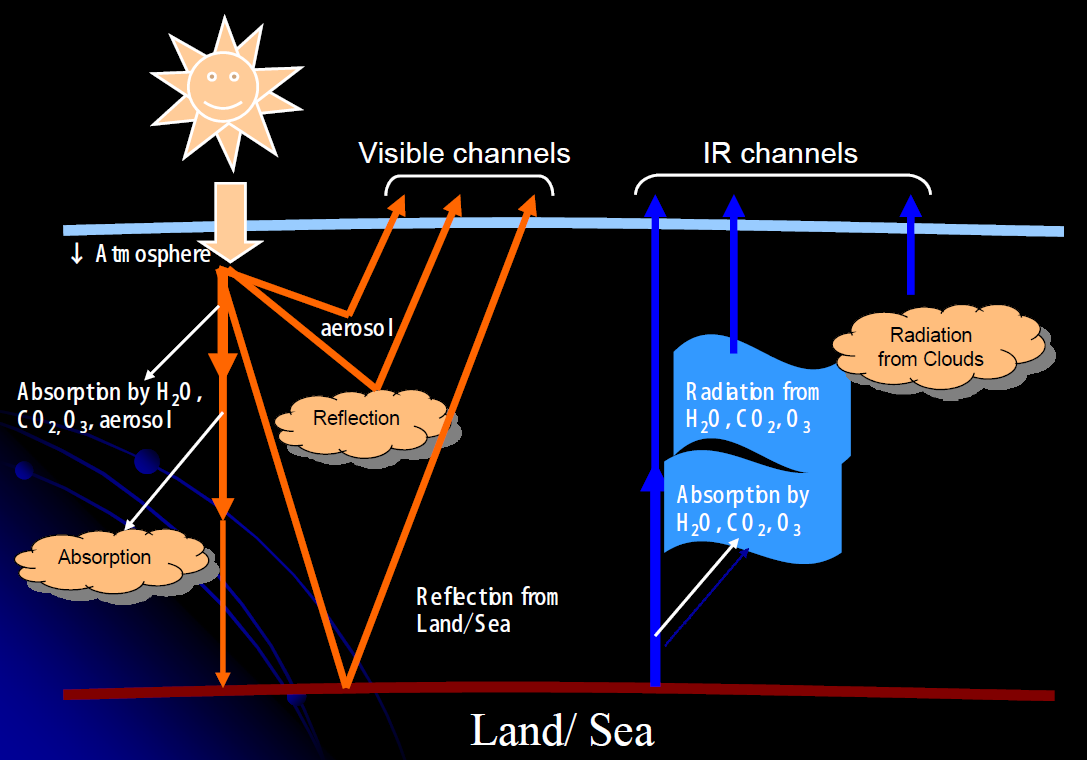
Picture 5. Propagation of infrared radiation in the atmosphere
As a result of interactions with the atmosphere, the intensity of solar radiation at the Earth's surface decreases by more than half compared to its value in the upper atmosphere.
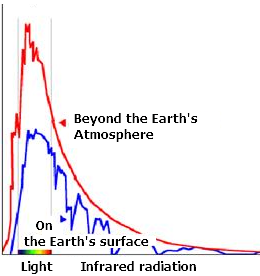
Picture 6. Graph of solar radiation intensity
Solar radiation coming to the Earth's surface is not completely absorbed by it. Part of the radiation is reflected by the surface, and only the upper layer of the earth's surface participates in the reflection, in which radiation is absorbed and transformed. This layer includes the entire herbage and vegetation of the forest, the first tens of meters of transparent and decimeters of turbid water, as well as decimeters of snow, several centimeters of sand and fractions of millimeters of dark soils. The reflectivity of the Earth's surface depends on the kind of bodies, their physical properties, color and condition. The ratio of reflected radiation to the total radiation of the Sun and atmosphere is called albedo. Albedo values are most often expressed as a percentage. The albedo of the earth's surface varies widely. This is due to the type of landscape zones, and in temperate and high latitudes, also with the change of seasons. Thus, in the central parts of the polar regions, the reflectivity is high and changes little in the annual course: in Antarctica – about 85%, in the central Arctic – about 80%. In July, the decrease in albedo in the Arctic (up to 65%) is associated with more intense snowmelt than in December in Antarctica. Average albedo values for different types of land surface (in %):

Picture 7. Average albedo values for different types of land surface
The albedo of the water surface is, on average, smaller than most natural land surfaces and depends on the angle of incidence of rays, the height of the Sun, the ratio of direct and scattered radiation, and the disturbance of the sea surface. When the Sun is at the zenith, the albedo of a calm sea for direct radiation is 2%. As the height of the Sun decreases, the albedo increases. When the ocean is very agitated, when foam and flaps are formed, the albedo of the sea increases. The following SIM cards show that some objects are better visible in the IR range. For example, thin clouds.
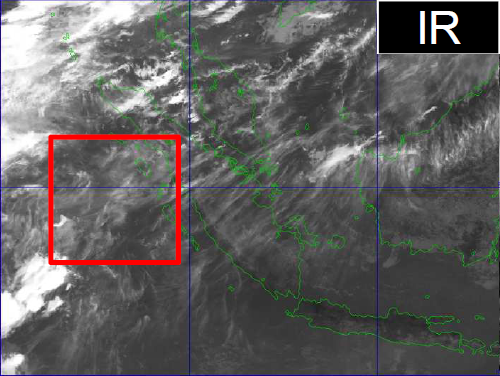
Picture 8. IR range
On the contrary, some objects are better visible in the visible range.
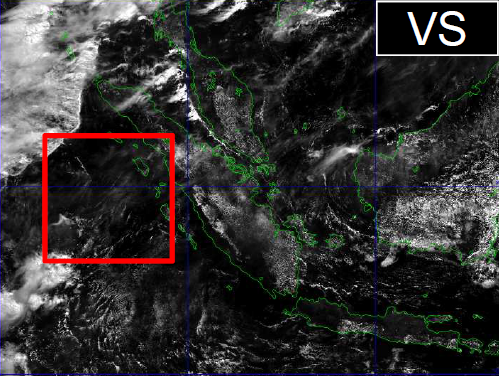
Picture 9. Visible range
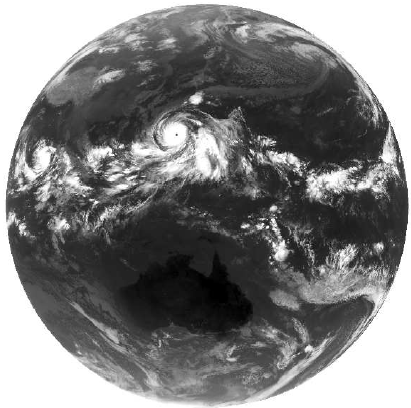
In infrared images, white corresponds to colder areas, and black corresponds to warmer ones. The clouds in these pictures are white not because they are white, but because they are cold.
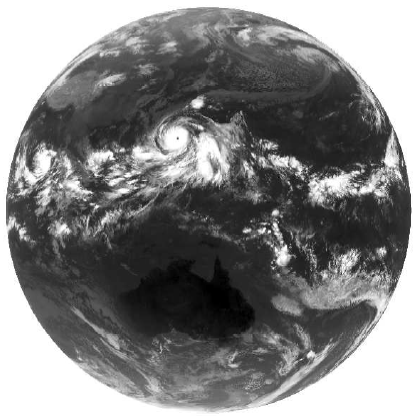
Picture 10. An example of clouds in the infrared range
By the temperature of the clouds, you can determine the height of the clouds, because the higher the clouds, the colder they are.
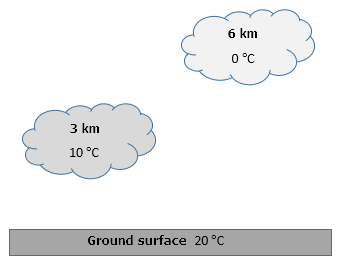
Picture 11. The difference in temperature and color of clouds
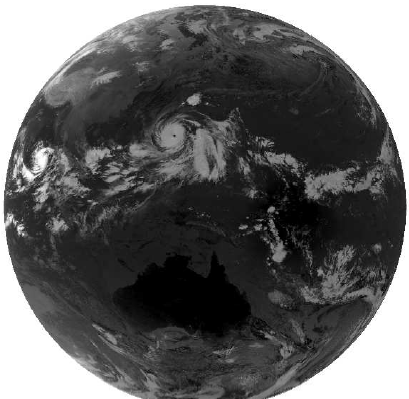
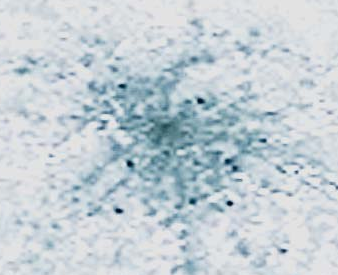
The range of IR radiation with a wavelength of 10 microns. The wave range of the Earth's strongest radiation with low absorption and re-emission (atmospheric window).
Picture 12. An example of clouds in the infrared range (with a wavelength of 10 microns)
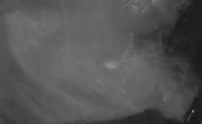
The range of IR radiation with a wavelength of 6.2 microns. Wave range with significant absorption by water vapor (Water vapor channel)
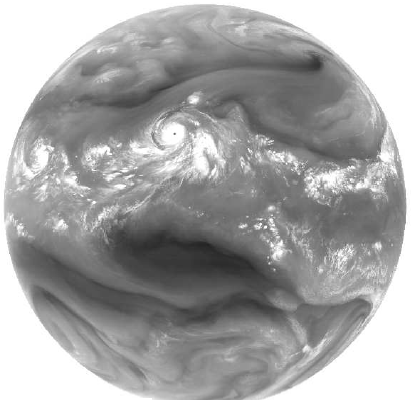
Picture 13. An example of clouds in the infrared range (with a wavelength of 6.2 microns)
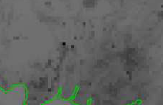
The range of IR radiation with a wavelength of 3.9 microns. Transmits information about solar radiation and Earth radiation at the same time. Allows you to visualize low clouds and fog at night.
Picture 14. An example of clouds in the infrared range (with a wavelength of 3.9 microns)
Also, the IR range allows you to see various warm objects – cities, and forest fires. The city of Moscow.
Picture 15. The city of Moscow in the IR range
A forest fire on the island of Kalimantan. Only smoke is visible in the visible range.
Picture 16. Forest fire on the island of Kalimantan in the visible range
In the IR range of 10 microns, there is also only smoke.

Picture 17. Forest fire on the island of Kalimantan in the infrared range (with a wavelength of 10 microns)
In the IR range of 4 microns, fire foci are clearly visible.
Picture 18. Forest fire on the island of Kalimantan in the infrared range (with a wavelength of 4 microns)
In order to see the fog at night, the method of subtracting IR signals is used. A signal with a wavelength of 4 microns is subtracted from a signal with a wavelength of 10 microns.
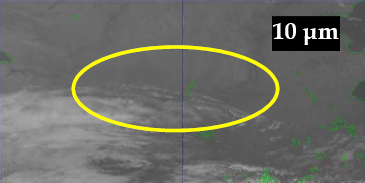
Picture 19. Fog in the infrared range (with a wavelength of 10 microns)
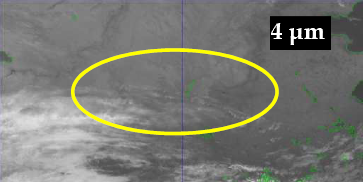
Picture 20. Fog in the infrared range (with a wavelength of 4 microns)
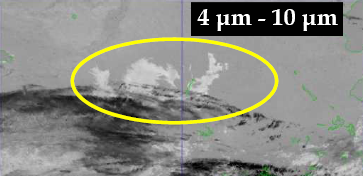
Picture 21. Fog in the infrared range (with a wavelength of 4-10 microns)
When creating the lesson, materials were used:
Materials from the Japan Meteorological Agency_;
Materials of the project ["Real-time satellite photos"](www.meteosputnik.ru MeteoSputnik);
M. A. Volkova, I. V. Kuzhevskaya "Climatology. Theoretical and applied aspects".