Lesson 5. Getting a photo from a NOAA satellite series
Getting to know NOAA series satellites
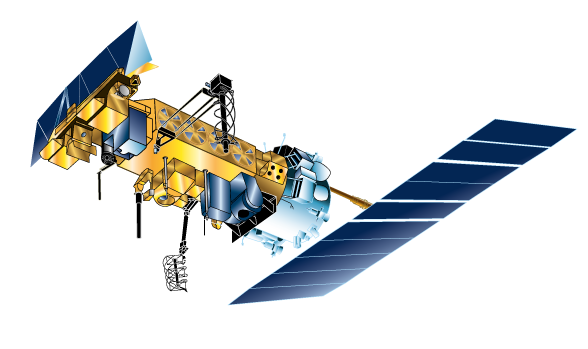
Picture 1. NOAA-17 spacecraft
The satellites of the NOAA series are spacecraft of the US National Oceanic and Atmospheric Administration (NOAA). They were launched into polar sun-synchronous circular orbits with a height of about 850 km.
NOAA-15 launched on May 13, 1998 into morning orbit;
NOAA-18 launched on May 20, 2005 into afternoon orbit;
NOAA-19 was launched on February 6, 2009 into afternoon orbit.
A solar synchronous orbit is an orbit in which a satellite passes over any point on the Earth's surface at approximately the same local solar time. To achieve such characteristics, the orbit parameters are selected in such a way that the orbit precesses in an easterly direction by 360 degrees per year (approximately 1 degree per day), compensating for the rotation of the Earth around the Sun.
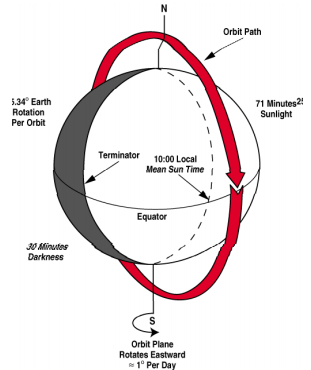
Picture 2. Solar synchronous orbit
The circulation period is about 101 minutes. The inclination of the orbit is 98 degrees, so the satellites have a good view of the polar regions. The manufacturer of NOAA satellites is Lockheed Martin Corporation, a type of TIROS-N satellite platform.
The following measuring instruments are installed on board:
High-resolution AVHRR/3 - 6 channels visible and near-infrared radiometer;
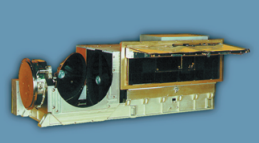
Picture 3. High resolution AVHRR/3 radiometer
Infrared meter HIRS/3 - 20 channels of visible and IR ranges;
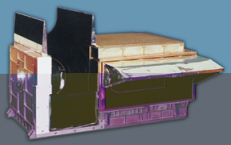
Picture 4. Infrared meter HIRS/3
Microwave probe AMSU-A - 15 channels of IR range;
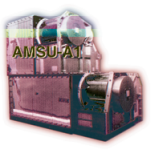
Picture 5. Solar synchronous orbit
Microwave probe AMSU-B - 5 channels of IR range;
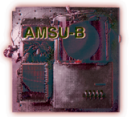
Picture 6. AMSU-B microwave probe
All these tools work in different parts of the infrared range and allow you to receive a large amount of information. NOAA satellites collect global data on cloud cover, surface conditions such as ice, snow and vegetation, atmospheric temperature, moisture distribution, aerosols and ozone. The satellites are also equipped with special devices that facilitate the search and rescue of those in distress. It is part of the COSPAS-SARSAT system, which is designed to detect and locate emergency radar transmitters, location-based emergency beacons and personal beacons operating at frequencies 121.5, 243 and 406.05 MHz.
Getting photos from NOAA series satellites.
The following software is used to obtain photographs from NOAA series satellites:
- SDR# for receiving a radio signal;
- Orbitron for tracking satellites and taking into account the Doppler effect;
- WXtoimg for decrypting images.
You can find all the necessary software on the page Installing the required software.
Launch SDR# and select the type of radio receiver: RTL-SDR connected via USB.
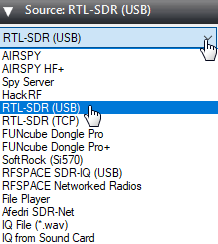
Picture 7. Choosing the type of radio receiver
In the Radio section, set the switch to WFM mode and set the bandwidth (Bandwidth) to 34000. Check that the check mark "Shift" is unchecked.
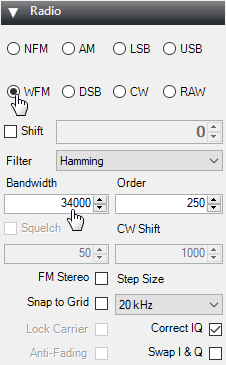
Picture 8. Switching to WFM mode
Make sure that the "Filter Audio" checkbox is unchecked.

Picture 9. Audio Settings
Next, you need to increase the signal gain. To do this, click on the gear.

Picture 10. Signal Settings
Move the slider so that the noise level increases by about 10dB.

Picture 11. Increasing the signal noise level
The signal from the NOAA series satellite looks something like this:
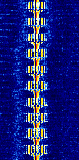
Picture 12. The signal from the NOAA series satellite
In the Tracking DDE Client section, if the Orbitron is connected correctly, information about the monitored satellites will appear.

Picture 13. Information about the tracked satellite
Launch Orbitron and update TLE first. Click on the button with the tools.

Picture 14. Launching settings
Click on the zipper button to update TLE.
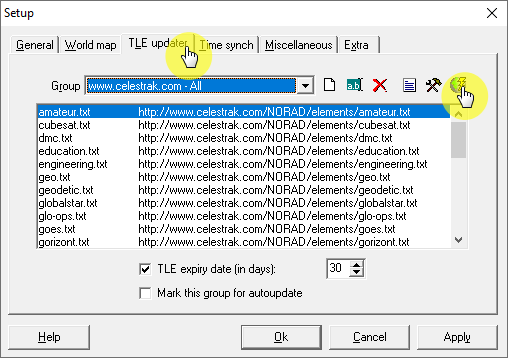
Picture 15. Orbitron Software Settings
Then select the file with information about weather satellites. Click on the "Load TLE" button.
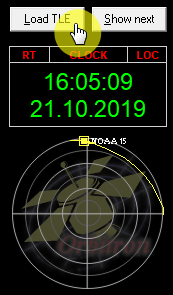
Picture 16. A file with information about weather satellites
Download the list weather.txt
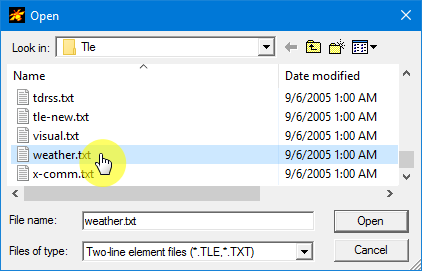
Picture 17. The list weather.txt
Only weather satellites will appear in the side list on the right. Select Meteor-M2, NOAA15, NOAA18, NOAA19.

Picture 18. Choosing satellites
The selected satellites will be displayed in the main program window.
Picture 19. The main window of the program
Then go to the "Calculation" tab and click on the "Calculation" button.

Picture 20. Carrying out the calculation
An automatic calculation of the time of flight of the satellites will be performed. Go to the "Rotor" tab/Radio" and make sure the tracking button is pressed.

Picture 21. Section "Rotor/Radio"
The following correct frequencies must be set in the receiving frequency window (Dnlink/MHz):
- NOAA 15 – 137.62 MHz;
- NOAA 18 – 137.91 MHz;
- NOAA 19 – 137.10 MHz.
Run WXtoimg and make sure that the signal source is configured correctly.

Picture 22. Setting up the signal source
Select the virtual CABLE Output.
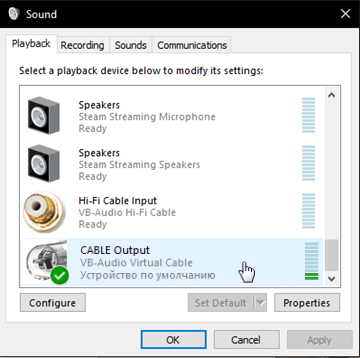
Picture 23. Selecting a signal source
Start recording.

Picture 24. Start recording
To receive signals, turn on Auto Recording (Auto Record).
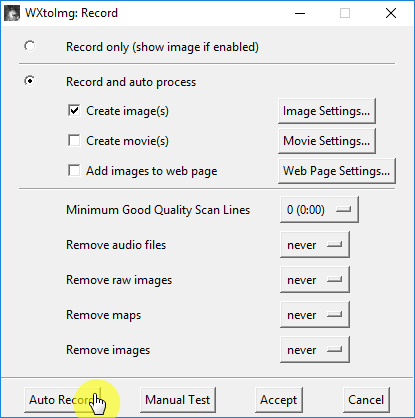
Picture 25. Enabling autorecording
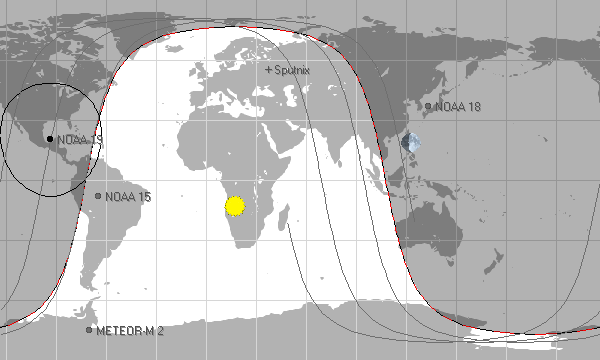
Now, when any satellite of the NOAA** series appears higher than 10 degrees above the horizon**, recording of the transmitted image will automatically start.
![]()
Picture 26. Automatic start of recording of the transmitted image
Make sure that the signal level in the lower right corner is green, if not, then increase the sound volume in SDR#.

Picture 27. Signal level identifier
With a good signal level, the resulting image will begin to appear line by line from below. On the left in the visible range, and on the right in the infrared.

Picture 28. Line-by-line image creation
Wait for the transmission to finish, and stop recording.
Switch to different information display modes and analyze the resulting images.
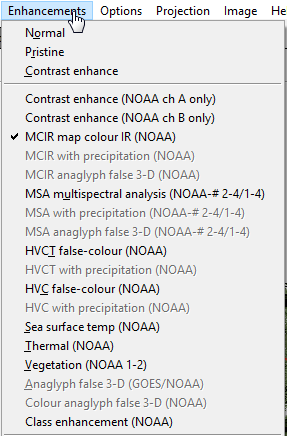
Picture 29. Switching information display modes
Compare the image with the one taken earlier and see how the situation in the atmosphere has changed.

Picture 30. The resulting image