Lesson 3. Getting a satellite photo
Setting up WXtoimg
To decrypt the signals received from satellites, there is a special program WXtoimg, which receives an audio signal received from the satellite using the program SDR#. When you first start WXtoimg, you need to configure your location. Go to Options → Ground Station Location enter the name of the city and specify your coordinates.
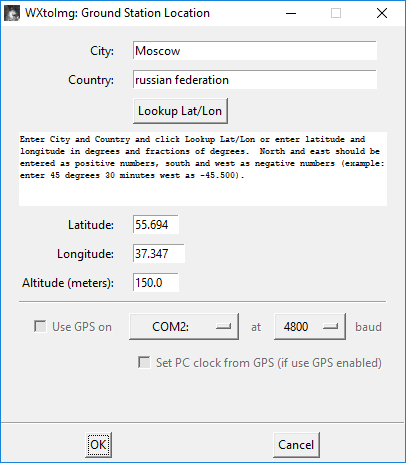
Picture 1. Setting up your location
Then go to Options → Recording Options and configure the audio source. In the soundcard section, specify CABLE Output.
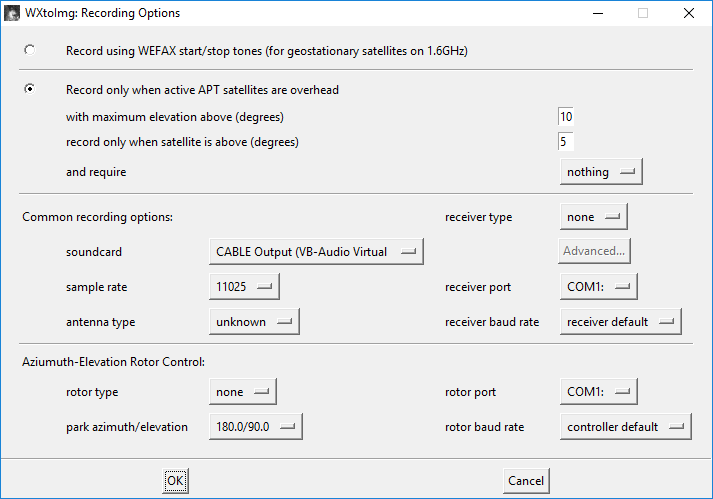
Picture 2. Setting the audio source
Update the TLE data.
Due to the move of the celestrak website to the domain .org TLE now needs to be updated manually. Link to the program for updating TLE in WXtoImg: Keplers-Updater.exe . During installation, the system will issue a warning about the danger of the file, it must be ignored.
For information about the installation progress of the program, go to website.
Each time you start WXtoimg, you need to check that the signal source is configured correctly.
Select the virtual CABLE Output.

Picture 3. Setting up the signal source
Start recording.

Picture 4. Selecting the signal source
To receive signals, turn on auto Recording (Auto Record).

Picture 5. Start recording
Now, when any satellite of the NOAA series appears higher than 10 degrees above the horizon, recording of the transmitted image will automatically start.
![]()
Picture 6. Automatically start recording the transmitted image
Make sure that the signal level in the lower right corner is green, if not, then increase the sound volume in SDR#.

Picture 7. Signal level identifier
With a good signal level, the resulting image will begin to appear line by line from below. On the left in the visible range, and on the right in the infrared.

Picture 8. Line-by-line image creation
Wait for the transmission to finish, and stop recording.

Picture 9. Stop recording
Start automatic processing of the received images.

Picture 10. Automatic processing of the received images
The resulting image will be processed automatically and the contours of the states will be applied to it. Pay attention to the interference that degrades the image.
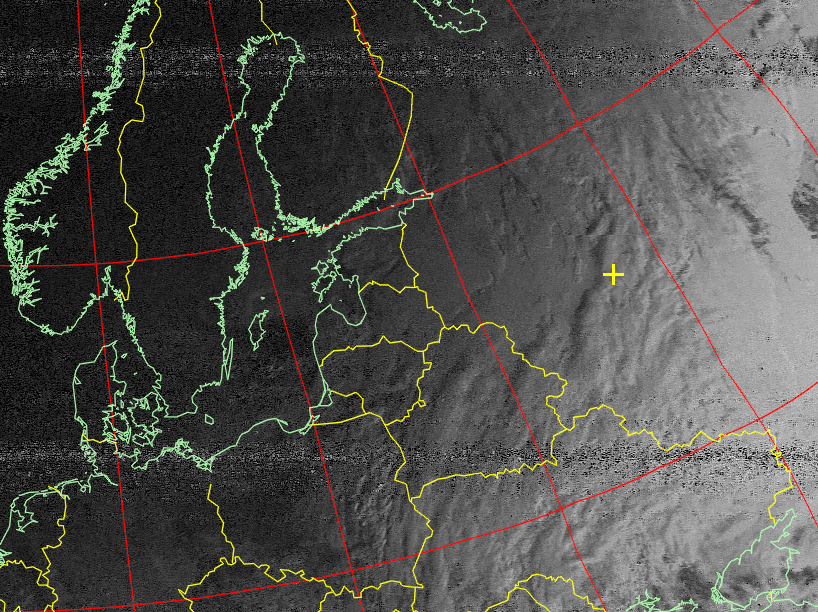
Picture 11. The image is in Normal mode
A number of images with various filters will be automatically generated from the resulting image. These images can be seen in the Saved Images section.

Picture 12. Saved Images section with saved images
You can also switch the types of image processing in the menu Enhancements (improvements).

Picture 13. Switching types of image processing
Enhancements Menu
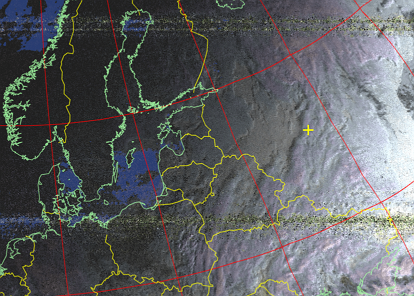
Increasing the contrast of channel A (visible range).
![]()
Picture 14. Increasing the contrast of channel A (visible range)
Picture 15. The resulting image
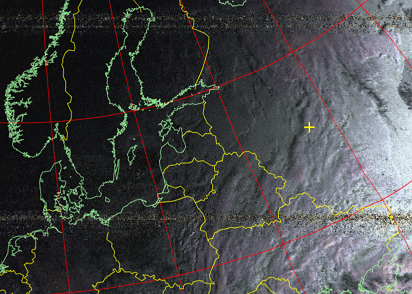
Increasing the contrast of the B channel (IR range).
![]()
Picture 16. Increasing the contrast of channel B (visible range)

Picture 17. The resulting image
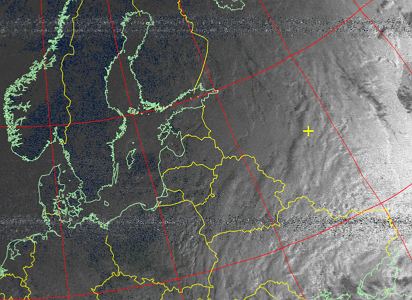
An image in the IR range with a map overlay. The seas are painted blue, the earth is green. High clouds look white, low clouds look gray. Darker colors indicate warmer areas.
![]()
Picture 18. An image in the IR range with a map overlay
Picture 19. The resulting image
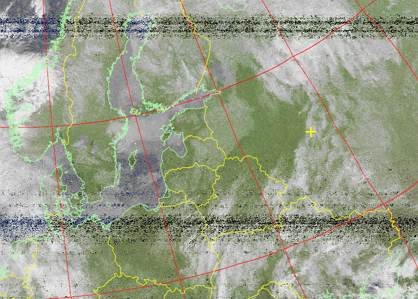
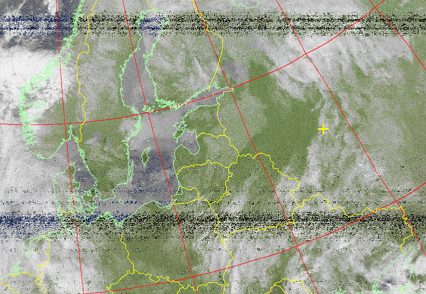
Multispectral analysis. An image in the visible and IR channels is used and it is determined which areas are most likely to be clouds, land or sea. The result is a bright image in false colors.

Picture 20. Multispectral analysis
Picture 21. The resulting image
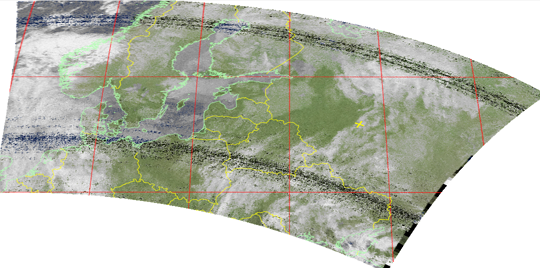
An image with blue water and with colors more suitable for the earth.
![Image with blue water and colors more suitable for the earth]
Picture 22. An image with blue water and colors more suitable for the earth
Picture 23. The resulting image
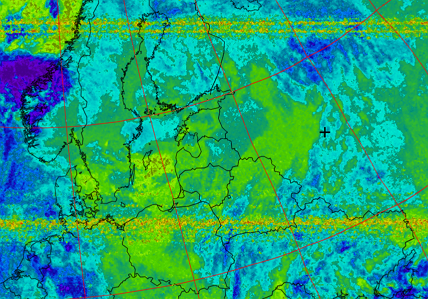
Creates a false color image based on temperature using the HVC color model.
![False color image based on temperature (based on the HVC color model)]
Picture 24. False color image based on temperature (based on the HVC color model)
Picture 25. The resulting image
Sea surface temperature. Creates a false color image based on sea surface temperature. No attempt is made to distinguish cloud or land from sea. The sea surface temperature may be incorrect due to the presence of thin or small clouds in the estimated pixel or due to noise in the signal.

Picture 26. False color image based on sea surface temperature
Picture 27. The resulting image
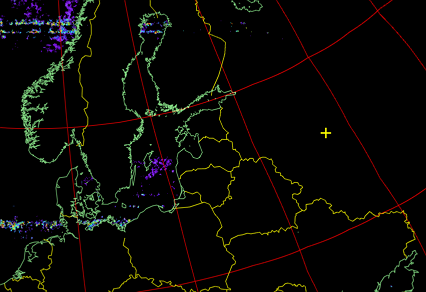
The image in false colors shows the temperature of clouds and the surface. Purple means low temperatures, and red means high temperatures.

Picture 28. The image is in false colors
Picture 29. The resulting image
It is possible to change the type of projection.

Picture 30. Changing the projection view
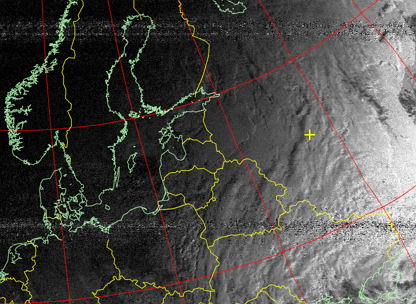
Normal projection:
Picture 31. Normal projection
Equally large cylindrical projection:
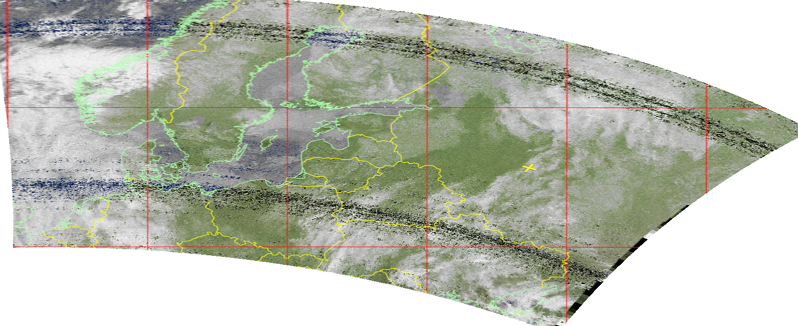
Picture 32. Equal-sized cylindrical projection
Eckert IV projection:
Picture 33. Eckert IV projection