Lesson 1. Receipt of radio signals using RTL-SDR
Frequency
The number of vibrations per second is measured in hertz.
1 kHz = 1000 Hz (one kilohertz is one thousand hertz);
1 MHz = 1,000 kHz = 1,000,000 Hz (one megahertz - one thousand kilohertz - one million hertz);
1 GHz = 1000 MHz = 1,000,000 kHz = 1,000,000,000 Hz (one gigahertz - one thousand megahertz).
Radio waves
Radio waves are electromagnetic waves with frequencies up to 3 THz, propagating in space. Electromagnetic waves appear in the space around conductors with electric current. Radio waves are mainly used for organizing radio communications, for radiolocation, cooking, and sometimes for medical purposes.
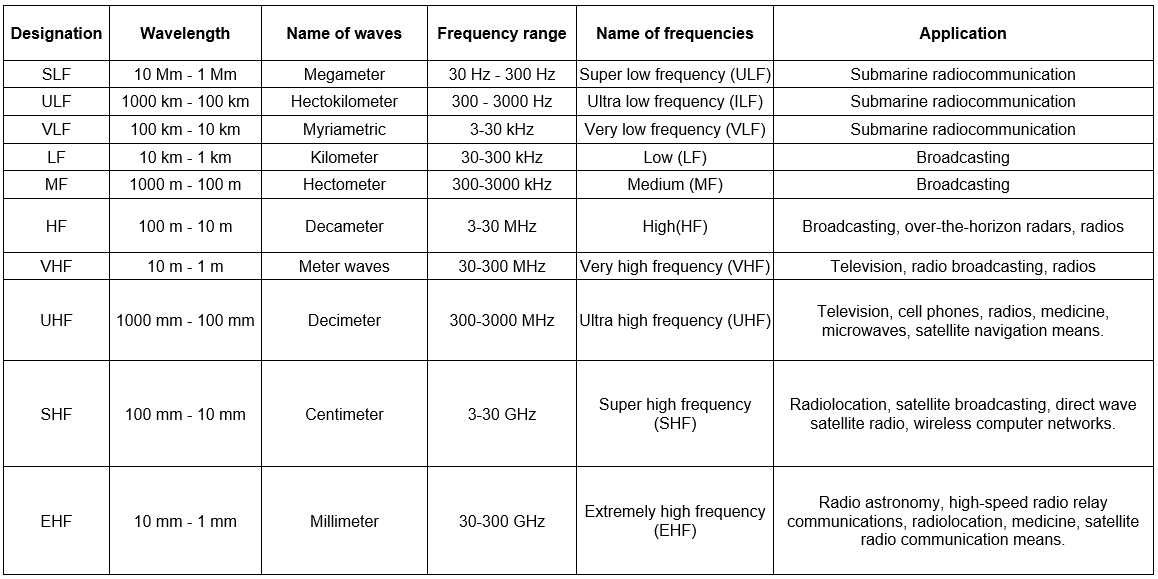
Picture 1. Information about radio waves
Meter and shorter radio waves are used to communicate with spacecraft units. Cubsat signals are mostly transmitted at the frequencies of 135 MHz and 433 MHz.
We can use an RTL-SDR type radio to receive the signal. It is represented by a software-defined radio (SDR) - a radio station, in which the main part of digital signal processing is done by an ordinary personal computer.
This makes it much cheaper and reduces radio station dimensions. Direct connection with a computer allows users to assess the received signal in a wide frequency band visually, as well as to learn such concepts as frequency, amplification, modulation, etc.
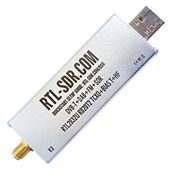
Picture 2. RTL-SDR receiver
This type of receiver allows users to receive signals in the frequency range from 0.5 MHz to 1750 MHz.
0.5 MHz = 500 kHz = 500,000 Hz;
1,750 MHz = 1,750,000 kHz = 1,750,000,000 Hz.
RTL.SDR is based on the R820T2 chip, which is an analog signal converter, and RTL2832U chip, which is a digital signal converter completed with the USB interface.

Picture 3. RTL-SDR receiver block diagram
The figure shows the block diagram of the RTL.SDR receiver. First, the R820T2 chip converts the analog signal into an intermediate frequency signal. Second, the intermediate frequency signal is transmitted to the analog-to-digital converter, which converts the incoming analog signal to the digital form (a flow of zeros and ones). The resulting signal is transferred via a USB connector to a computer for subsequent digital processing and output to the monitor. The most complex components of the superheterodyne receiver (filters and demodulators) are implemented in the digital form in the computer, which provides a cheap and more flexible solution.
Introduction to the SDR# software
Let's get familiarize oneselves with capabilities of the SDR# software applied to receive signals from FM radio stations. Run the SDR# software. Control means are located on the left side of the window, and the spectrum of received signals provided in two forms is displayed on the right.
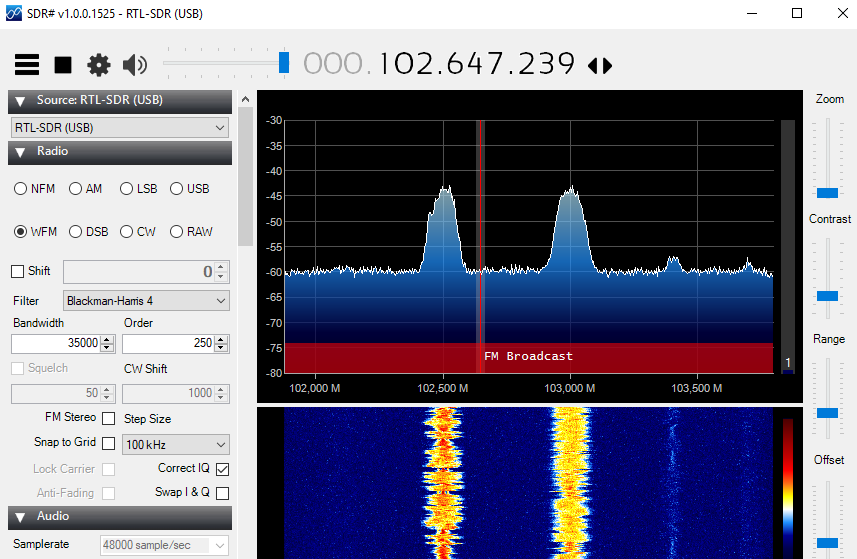
Picture 4. The main window of the SDR program #
The upper graph shows the instantaneous signal strength deposited along the vertical axis.
At the bottom, the power is displayed in brightness and color, and the time is shown on the vertical axis. This graph is called a waterfall.
The frequency of the received signals is displayed on the horizontal axis.
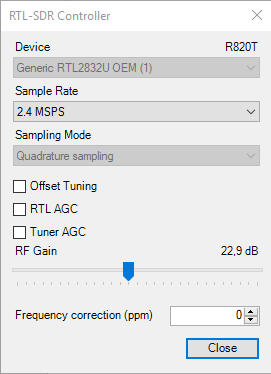
When you first start the program, you must select the type of radio: RTL-SDR connected via USB.
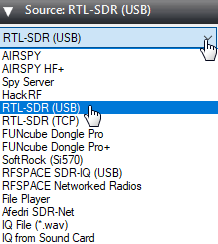
Picture 5. Choosing a radio source
In the Radio section, set the switch to the WFM mode and set the bandwidth to 100000.
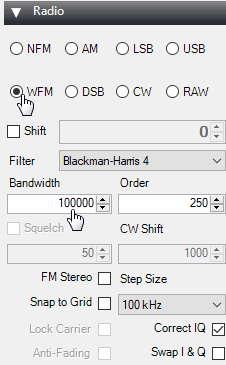
Picture 6. The "Radio" section
Set the frequency of reception, for example.
![]()
Picture 7. An example of the reception frequency
If you are in Moscow, then there will be a powerful signal from the radio station on this frequency.
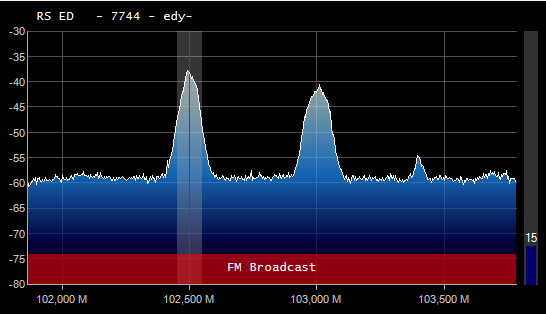
Picture 8. The signal from the radio station
If you turn up the volume now, you can hear a radio broadcast.
![]()
Picture 9. Increase the volume
The graph clearly shows that another radio station is broadcasting at 103.0 Fm. The appearance of the graph can be changed using the sliders located on the right edge of the screen.

Picture 10. Chart Appearance Settings
If you click on the frequency line and move it to the right or left, you can find other radio stations.
![]()
Picture 11. Setting up the frequency line
To receive weak signals, it is necessary to increase the signal gain. To do this, click on the gear.

Picture 12. Signal Settings
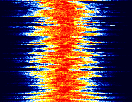
Move the slider so that the noise level increases by about 10 dB.
Picture 13. Changing the noise level

Picture 14. Signal before and after amplification
Task 1
Move the frequency line and listen to all Fm radio stations.
Decibels.
Decibel is a relative value that shows how many times one signal is stronger than another.
- 1 dB - 1.25 times, 3 dB - 2 times, 10 dB - 10 times.
When adding decibels, you need to multiply the time:
6 dB = 3 dB + 3 dB (2 · 2 = 4 times)
9 dB = 3 dB + 3 dB + 3 dB (2 · 2 · 2 = 8 times)
13 dB = 10 dB + 3 dB (10 · 2 = 20 times)
20 dB = 10 dB + 10 dB (10 · 10 = 100 times)
30 dB = 10 dB + 10 dB + 10 dB (10 · 10 · 10 = 1000 times)
Frequency ranges.
All radio frequencies are divided into several bands. Some frequency bands are used for communication by military and special services - civilians are prohibited from broadcasting in such bands. But there are also "open" frequency ranges in which amateur radio operators and civil organizations are allowed to work - air traffic controllers, railway workers, power engineers, etc. You will find the following frequency ranges marked in color in SDR#.
- Long wave range (DV).

Picture 15. The range of long waves
- The range of medium waves (CB).

Picture 16. Medium wave range
- Shortwave range of 160m (KV).

Picture 17. Shortwave range 160m
- Shortwave range of 80m (KV).

Picture 18. 80m shortwave range
- Shortwave range of 40m (KV).

Picture 19. Shortwave range of 40m
- Shortwave range of 20m (KV).

Picture 20. Shortwave range of 20m
- Shortwave range of 15m (KV).

Picture 21. Shortwave range 15m
- The civilian band is 27 MHz. (Citizen's Band). All radios work in this range.

Picture 22. The civil band is 27 MHz
- Shortwave range of 10m (KV).

Picture 23. 10m shortwave range
- Frequency range of FM radio stations from 87.5 to 108 MHz (VHF)

Picture 24. Frequency range of FM radio stations
- Frequency range of air traffic controllers from 108 to 137 MHz (VHF)

Picture 25. Frequency range of air traffic controllers
- Amateur radio range 144-148 MHz (VHF)

Picture 26. Amateur radio range 144-148 MHz
- The military frequency range is from 225 to 380 MHz. (VHF)

Picture 27. Military frequency range
- Amateur radio range from 430 to 440 MHz (VHF)

Picture 28. Amateur radio range 430-440 MHz
Task 2
Move the frequency line and find all ranges from 0 to 500 MHz.
Types of modulation.
Modulation is used to improve the quality of the radio signal. Modulation is a special way of encoding a signal. For example, all radio stations that broadcast in the FM band encode the signal in a special way called frequency modulation (FM in English). The next popular modulation method is amplitude modulation (AM in English). A continuous signal is used to transmit Morse code signals. Signals with different modulations look different in SDR#.
Frequency modulation.
Typical frequencies: ultrashort waves from 87.5 to 108 MHz
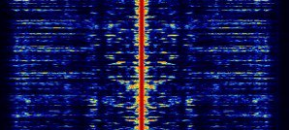
The image of the signal.
Picture 29. Frequency modulation
Amplitude modulation.
Typical frequencies:
Long waves - from 153 to 279 kHz
Medium waves - from 531 to 1.611 kHz
Short waves - from 2.3 to 26.1 MHz
Negotiations of air traffic controllers - from 108 to 137 MHz
The image of the signal.
Picture 30. Amplitude modulation
As a rule, the SDR# program itself correctly determines the type of modulation characteristic of the radio wave band. Manual modulation can be switched in the Radio section. FM modulation is called WFM here.

Picture 31. Switching to manual modulation
Task 3
Find a radio station in the FM band and switch the modulation modes. The normal sound will only be heard when the WFM is modulated.
Task 4
Find the conversations of air traffic controllers in the range from 108 to 137 MHz. Normal sound will be heard only with AM modulation.